- DownloadSemiconductor Toolkit: Tools to create wafer maps, add wafer geometry to graphics, explore die defects & compare wafers.
- Discovery Summit 2026: Early User Edition - September 23-24.Register. It's free.
- JMP multivariate capabilities let you understand relationships between multiple variables simultaneously. See how. Friday, Aug. 14, 2 pm US ET.
- Subscribe to RSS Feed
- Mark Topic as New
- Mark Topic as Read
- Float this Topic for Current User
- Bookmark
- Subscribe
- Mute
- Printer Friendly Page
Discussions
Solve problems, and share tips and tricks with other JMP users.- JMP User Community
- :
- Discussions
- :
- How do I make a histogram (not a bar chart) with different colors based on value...

- Mark as New
- Bookmark
- Subscribe
- Mute
- Subscribe to RSS Feed
- Get Direct Link
- Report Inappropriate Content
How do I make a histogram (not a bar chart) with different colors based on values?
I would like to make frequency histograms similar to figure A5 in this paper Long-Term Prognostic Risk After Neoadjuvant Chemotherapy Associated With Residual Cancer Burden and ...
- Tags:
- windows
Accepted Solutions


- Mark as New
- Bookmark
- Subscribe
- Mute
- Subscribe to RSS Feed
- Get Direct Link
- Report Inappropriate Content
Re: How do I make a histogram (not a bar chart) with different colors based on values?
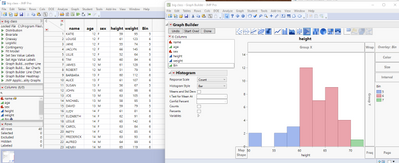
This is easily done using Graph Builder. All you have to do is to define an ordinal or character column that identifies the bin/grouping that you want to have the different bars in the histogram colored together. Then create the histogram in Graph Builder and drop the bin/grouping column on the Overlay area.

- Mark as New
- Bookmark
- Subscribe
- Mute
- Subscribe to RSS Feed
- Get Direct Link
- Report Inappropriate Content
Re: How do I make a histogram (not a bar chart) with different colors based on values?
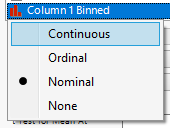
Your x-axis (Column 1) is Nominal and it most likely should be Continuous
- Mark as New
- Bookmark
- Subscribe
- Mute
- Subscribe to RSS Feed
- Get Direct Link
- Report Inappropriate Content
Re: How do I make a histogram (not a bar chart) with different colors based on values?
right click on the histogram axis and you can set the interval there
- Mark as New
- Bookmark
- Subscribe
- Mute
- Subscribe to RSS Feed
- Get Direct Link
- Report Inappropriate Content
Re: How do I make a histogram (not a bar chart) with different colors based on values?
This is easily done using Graph Builder. All you have to do is to define an ordinal or character column that identifies the bin/grouping that you want to have the different bars in the histogram colored together. Then create the histogram in Graph Builder and drop the bin/grouping column on the Overlay area.
- Mark as New
- Bookmark
- Subscribe
- Mute
- Subscribe to RSS Feed
- Get Direct Link
- Report Inappropriate Content
Re: How do I make a histogram (not a bar chart) with different colors based on values?
Thanks, txnelson!
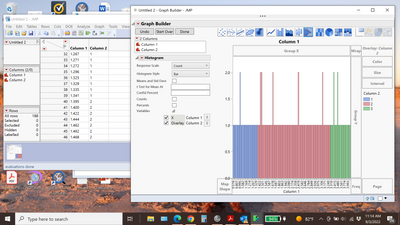
Do I need a third column to set the bin width and would I drag that to Interval?
Right now I have a bar for every unique value.
- Mark as New
- Bookmark
- Subscribe
- Mute
- Subscribe to RSS Feed
- Get Direct Link
- Report Inappropriate Content
Re: How do I make a histogram (not a bar chart) with different colors based on values?
Your x-axis (Column 1) is Nominal and it most likely should be Continuous
- Mark as New
- Bookmark
- Subscribe
- Mute
- Subscribe to RSS Feed
- Get Direct Link
- Report Inappropriate Content
Re: How do I make a histogram (not a bar chart) with different colors based on values?
right click on the histogram axis and you can set the interval there
Recommended Articles
- © 2026 JMP Statistical Discovery LLC. All Rights Reserved.
- Terms of Use
- Privacy Statement
- Contact Us