- Instantly extract effect sizes, F-ratios, and FDR-adjusted p-values from your models with the Calculate Effects Sizes extension, available now in the JMP Marketplace!
- New to JMP? Join us Sept. 23-24 for the Early User Edition of Discovery Summit, tailor-made for new users. Register now for free!
- Your voice matters! Tell us how you prefer to receive JMP updates, so we can tailor our communication to your needs. Take short survey.
- Subscribe to RSS Feed
- Mark Topic as New
- Mark Topic as Read
- Float this Topic for Current User
- Bookmark
- Subscribe
- Mute
- Printer Friendly Page
Discussions
Solve problems, and share tips and tricks with other JMP users.- JMP User Community
- :
- Discussions
- :
- How do I get prediction formula as DOE design using Fit model in analyze

- Mark as New
- Bookmark
- Subscribe
- Mute
- Subscribe to RSS Feed
- Get Direct Link
- Report Inappropriate Content
How do I get prediction formula as DOE design using Fit model in analyze
Hello,
I made a experimental design manually and paste it into JMP table instead of using DOE design tool available in JMP.
After adding all required response, I ran fit model to analyze the data and get a model formula. I constructed model effects using response surface in Macros.
After running, I checked the formula but that is not in the form as I expected.
For example, I set temperature range between 100 and 140 with the center point 120. So this level can be coded between -1 and 1 by (temperature-120)/20.
I expected that I will get the prediction equation in the coded form but what I got is the formula with different constant. Could you please let me know how to solve this issue? Thank you for all your help!
Best regards,
Accepted Solutions

- Mark as New
- Bookmark
- Subscribe
- Mute
- Subscribe to RSS Feed
- Get Direct Link
- Report Inappropriate Content
Re: How do I get prediction formula as DOE design using Fit model in analyze
First, welcome to the forum. Second, if you can attach your JMP file to your post, that is helpful to us (you can anonymize it).
When you run fit model, JMP will analyze the data (coded in the background) and then transform the beta coefficients back to the original level setting in your table. If you want a coded model, you should code the levels before you run fit model. Coding should be equi-distant centered on 0 e.g., -1,1 for a 2 level factor, -1,0,-1 for a three level factor)
- Mark as New
- Bookmark
- Subscribe
- Mute
- Subscribe to RSS Feed
- Get Direct Link
- Report Inappropriate Content
Re: How do I get prediction formula as DOE design using Fit model in analyze
Thanks for adding your JMP table. I don't understand your question...The model will be written in whatever levels were used for analysis. So if the left one (screenshot) was with actual values and the right one was with coded levels, the models will, of course, be different. Realize the beta coefficients get multiplied by the terms and so they must be adjusted for the actual levels when writing the model. They are coded to normalize the slopes so they can be compared for significance.
A great test is to save the prediction formulas to the table (Red triangle next to Response Yield)>Save Columns>Prediction formula. Once you have done this, you can put in values for the factors that are significant (just add rows to the table) and JMP will predict the results using the model saved. Do the results make sense?
I looked at your data set, and I'm not sure how you got to the model(s) you did? Did you analyze the effects to determine which ones were significant and then reduce the model to the significant terms? I can see some of the terms you included have very little effect. There are some funky residuals as well. Looks like biomass and temp have the biggest effects. IL and Time may interact with biomass, but their main effects are negligible.
I ran fit models for both uncoded and coded (after reducing the models) and saved the prediction formulas to the table.
- Mark as New
- Bookmark
- Subscribe
- Mute
- Subscribe to RSS Feed
- Get Direct Link
- Report Inappropriate Content
Re: How do I get prediction formula as DOE design using Fit model in analyze
First, welcome to the forum. Second, if you can attach your JMP file to your post, that is helpful to us (you can anonymize it).
When you run fit model, JMP will analyze the data (coded in the background) and then transform the beta coefficients back to the original level setting in your table. If you want a coded model, you should code the levels before you run fit model. Coding should be equi-distant centered on 0 e.g., -1,1 for a 2 level factor, -1,0,-1 for a three level factor)
- Mark as New
- Bookmark
- Subscribe
- Mute
- Subscribe to RSS Feed
- Get Direct Link
- Report Inappropriate Content
Re: How do I get prediction formula as DOE design using Fit model in analyze
Hello,
Thank you for providing me with great explanation.
I am still confused. So, is the transformation of the beta coefficient back to the original level valid when I design the experiment using DOE tool?
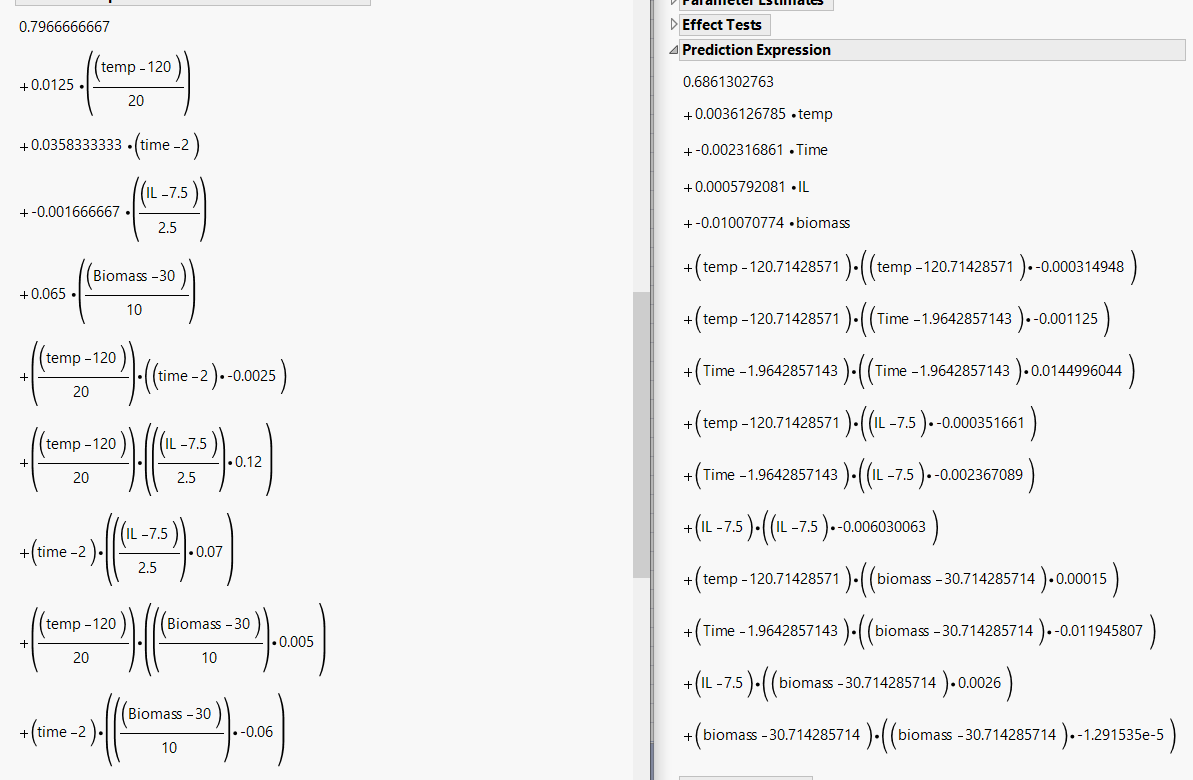
I attached my file and prediction expression captured. Left one is expression when I used DOE tool and right one is what I got with the manually designed experimental run.
I think it should be same.
Best regards
- Mark as New
- Bookmark
- Subscribe
- Mute
- Subscribe to RSS Feed
- Get Direct Link
- Report Inappropriate Content
Re: How do I get prediction formula as DOE design using Fit model in analyze
Thanks for adding your JMP table. I don't understand your question...The model will be written in whatever levels were used for analysis. So if the left one (screenshot) was with actual values and the right one was with coded levels, the models will, of course, be different. Realize the beta coefficients get multiplied by the terms and so they must be adjusted for the actual levels when writing the model. They are coded to normalize the slopes so they can be compared for significance.
A great test is to save the prediction formulas to the table (Red triangle next to Response Yield)>Save Columns>Prediction formula. Once you have done this, you can put in values for the factors that are significant (just add rows to the table) and JMP will predict the results using the model saved. Do the results make sense?
I looked at your data set, and I'm not sure how you got to the model(s) you did? Did you analyze the effects to determine which ones were significant and then reduce the model to the significant terms? I can see some of the terms you included have very little effect. There are some funky residuals as well. Looks like biomass and temp have the biggest effects. IL and Time may interact with biomass, but their main effects are negligible.
I ran fit models for both uncoded and coded (after reducing the models) and saved the prediction formulas to the table.
- Mark as New
- Bookmark
- Subscribe
- Mute
- Subscribe to RSS Feed
- Get Direct Link
- Report Inappropriate Content
Re: How do I get prediction formula as DOE design using Fit model in analyze
Apologize for unclear description. Left one and right one are from the same actual value. Difference is that the data table for the left one is generated by using DOE response surface tool and the data table for the right one is entered by myself. Then, I ran fit model with response surface model. I thought that the prediction expression for both should look same because I used the same actual value and response values. They look different but I confirmed that the predicted values are same.
So, is it right that this difference is because of the code in the background that there is the code to rewrite the prediction expression for DOE?
Yes. I am checking the significance of the effect and reducing the model to the significant terms. Before moving on, I would like to make this sure not to make any mistake later. I am quite new for this program. Please understand my situation. Thank you for your comments and it helps a lot. Also thank you for sharing the file you edited. I am able to learn other functions you opened. It helps me a lot.
Best regards
Recommended Articles
- © 2026 JMP Statistical Discovery LLC. All Rights Reserved.
- Terms of Use
- Privacy Statement
- Contact Us