- Subscribe to RSS Feed
- Mark Topic as New
- Mark Topic as Read
- Float this Topic for Current User
- Bookmark
- Subscribe
- Mute
- Printer Friendly Page
Discussions
Solve problems, and share tips and tricks with other JMP users.- JMP User Community
- :
- Discussions
- :
- Re: How do I change legend color on graph builder with box plots?
- Mark as New
- Bookmark
- Subscribe
- Mute
- Subscribe to RSS Feed
- Get Direct Link
- Report Inappropriate Content
How do I change legend color on graph builder with box plots?
Hello,
I am trying to change the second item in the legend to be black instead of red.
Inside of my graph builder function I use the following line of code to do this. (line color 0 = black)
Dispatch( {}, "400", ScaleBox, {Legend Model( 3, Properties( 1, {Line Color( 0 )}, Item ID("4TB", 1 ) ) )} )This is how my plot turns out:
The box plot turns black, but the legend is blue, and the outlier data points are blue. They should be black.
Am I missing an extra line of code to change the data points to be black?
Thanks for the help!
- Mark as New
- Bookmark
- Subscribe
- Mute
- Subscribe to RSS Feed
- Get Direct Link
- Report Inappropriate Content
Re: How do I change legend color on graph builder with box plots?
Make the changes interactively in Graph Builder, then click the red triangle at the top and select Save Script > To Script Window. You will see the code that necessary to get all the changes that you want.
- Mark as New
- Bookmark
- Subscribe
- Mute
- Subscribe to RSS Feed
- Get Direct Link
- Report Inappropriate Content
Re: How do I change legend color on graph builder with box plots?
I realized that it is another problem. I can make the graph as @Mark_Bailey suggested by saving the script and running that. But when I save as journal and open it the plot has the wrong color.
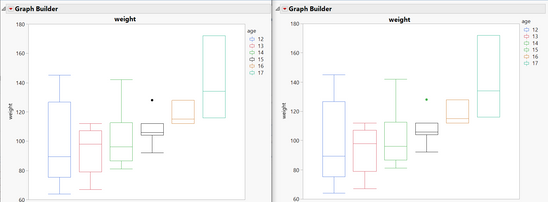
On the left I have the plot I created with age = 15 set to black.
On the right is the same plot but it has been saved as journal and opened. Now age = 15 has a green data point that should be black.
Thanks,
Kelly
Recommended Articles
- © 2026 JMP Statistical Discovery LLC. All Rights Reserved.
- Terms of Use
- Privacy Statement
- Contact Us


