- Don’t miss your chance to experience Discovery Summit Europe at our best available rate! Early bird registration through 31 Oct.
- Graph Builder Toolbar streamlines interactive graphing. Creates shortcuts on Report and GraphBuilder Helpers toolbars. Download and install the extension.
- JMP will suspend normal business operations for our Rest and Recharge Day on Friday, October 2, 2026.
Regular business hours will resume on Monday, October 5, 2026.
- Subscribe to RSS Feed
- Mark Topic as New
- Mark Topic as Read
- Float this Topic for Current User
- Bookmark
- Subscribe
- Mute
- Printer Friendly Page
Discussions
Solve problems, and share tips and tricks with other JMP users.- User Community
- :
- Discussions
- :
- How do I add mean and standard deviation bar in Bivariate fit

- Mark as New
- Bookmark
- Subscribe
- Mute
- Subscribe to RSS Feed
- Get Direct Link
- Report Inappropriate Content
How do I add mean and standard deviation bar in Bivariate fit
Hi, I have a question regarding bivariate fit curve in JMP 17.0. Is there a way I can get the mean and standard deviation bar appear on the graph instead of having all results at the same time point?
Attached is a example of the graph I am working.


- Mark as New
- Bookmark
- Subscribe
- Mute
- Subscribe to RSS Feed
- Get Direct Link
- Report Inappropriate Content
Re: How do I add mean and standard deviation bar in Bivariate fit
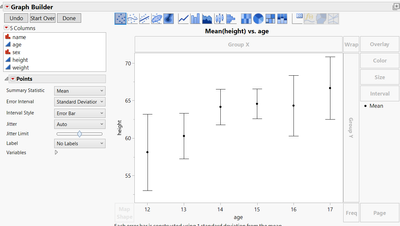
You can either turn on Summary Statistics in Bivariate or use Graph Builder and add the Caption Box from the top ribbon and enable mean and stdev to get the values.
If you want to visualize stdev as error intervals, use Graph Builder and from the Points options set summary statistic to mean and error interval to standard deviation.
- Mark as New
- Bookmark
- Subscribe
- Mute
- Subscribe to RSS Feed
- Get Direct Link
- Report Inappropriate Content
Re: How do I add mean and standard deviation bar in Bivariate fit
Thanks for the quick reply. So that means there is no way we can show standard deviation bar in bivariate fit curve?
- Mark as New
- Bookmark
- Subscribe
- Mute
- Subscribe to RSS Feed
- Get Direct Link
- Report Inappropriate Content
Re: How do I add mean and standard deviation bar in Bivariate fit
Not in Bivariate, but if you make your X variable (time point) into an ordinal modeling type, which would turn the Bivariate into a Oneway analysis, then you can turn it on from the Oneway red triangle Means and Std Dev.


- Mark as New
- Bookmark
- Subscribe
- Mute
- Subscribe to RSS Feed
- Get Direct Link
- Report Inappropriate Content
Re: How do I add mean and standard deviation bar in Bivariate fit
Roger that, thank you.
Recommended Articles
- © 2026 JMP Statistical Discovery LLC. All Rights Reserved.
- Terms of Use
- Privacy Statement
- Contact Us