- Image to Table JMP extension imports single or batch images as data tables. Useful to extract curves from pictures or convert image data to curve data to use in analyses like Functional Data Explorer. Download and install the extension.
- Subscribe to RSS Feed
- Mark Topic as New
- Mark Topic as Read
- Float this Topic for Current User
- Bookmark
- Subscribe
- Mute
- Printer Friendly Page
Discussions
Solve problems, and share tips and tricks with other JMP users.- User Community
- :
- Discussions
- :
- How can use JMP to decompose a curve into an original three-condition curve?
- Mark as New
- Bookmark
- Subscribe
- Mute
- Subscribe to RSS Feed
- Get Direct Link
- Report Inappropriate Content
How can use JMP to decompose a curve into an original three-condition curve?
Hello, everyone!
The Y curve is the sum of the other three curves.
Specific formula is: Y = Max + mid + min + 10
If only know Y, I need to restore the three curves of "Max", "mid" and "min".
I've looked it up and it looks like I can do it with the Fourier transform.
I would like to ask if there is a corresponding module with JMP to achieve this restore.
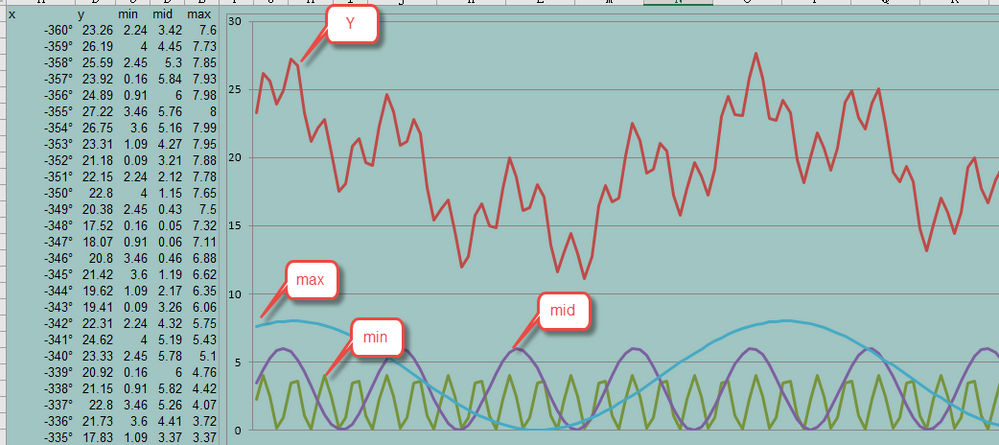
The excel formula of the other three curves is:
min=ROUND(2*SIN(80*RADIANS(:x)+RADIANS(7)),10)+2
mid=ROUND(3*SIN(21*RADIANS(:x)+RADIANS(8)),10)+3
max=ROUND(4*SIN(5*RADIANS(:x)+RADIANS(64)),10)+4
Thanks!
- Mark as New
- Bookmark
- Subscribe
- Mute
- Subscribe to RSS Feed
- Get Direct Link
- Report Inappropriate Content
Re: How can use JMP to decompose a curve into an original three-condition curve?
Thank markbailey!
JMP is very powerful and I use very little of it.
- Mark as New
- Bookmark
- Subscribe
- Mute
- Subscribe to RSS Feed
- Get Direct Link
- Report Inappropriate Content
Re: How can use JMP to decompose a curve into an original three-condition curve?
I am just beginning to learn in this area.It's not so simple to switch to real data:
I tried FFT, FIT model, and time series.

I didn't turn on the right approach,
The trouble experts continued to guide me.
Thanks Experts!
- Mark as New
- Bookmark
- Subscribe
- Mute
- Subscribe to RSS Feed
- Get Direct Link
- Report Inappropriate Content
Re: How can use JMP to decompose a curve into an original three-condition curve?
According to Craige FFT analysis, the real curve should be divided into more curves.
I don't know how to adjust the parameters with the FIT model.
Thanks!

- Mark as New
- Bookmark
- Subscribe
- Mute
- Subscribe to RSS Feed
- Get Direct Link
- Report Inappropriate Content
Re: How can use JMP to decompose a curve into an original three-condition curve?
Time Series

- « Previous
-
- 1
- 2
- Next »
Recommended Articles
- © 2026 JMP Statistical Discovery LLC. All Rights Reserved.
- Terms of Use
- Privacy Statement
- Contact Us