- New to JMP? Join us Sept. 23-24 for the Early User Edition of Discovery Summit, tailor-made for new users. Register now for free!
- Use World Cup data to build models, explore spatial relationships, and create informative visualizations in JMP. Register. July 17, 2 pm US Eastern Time.
- Your voice matters! Tell us how you prefer to receive JMP updates, so we can tailor our communication to your needs. Take short survey.
- Subscribe to RSS Feed
- Mark Topic as New
- Mark Topic as Read
- Float this Topic for Current User
- Bookmark
- Subscribe
- Mute
- Printer Friendly Page
Discussions
Solve problems, and share tips and tricks with other JMP users.- JMP User Community
- :
- Discussions
- :
- How can I "autoscale" functional / spectroscopic data?

- Mark as New
- Bookmark
- Subscribe
- Mute
- Subscribe to RSS Feed
- Get Direct Link
- Report Inappropriate Content
How can I "autoscale" functional / spectroscopic data?
Hello,
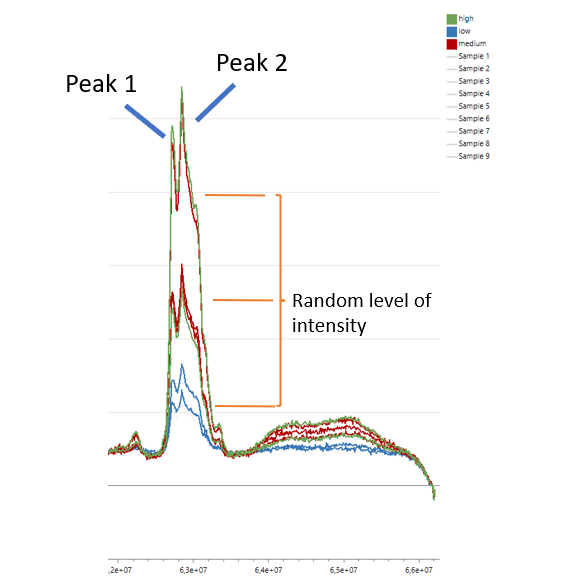
I have some Raman spectroscopy data, i.e. continous data (x: wavenumer, y: intensity) that I would like to analyse in JMP.
I am interested in how different sample treatments affect the ratios between the first and second peak (see picture), but due to the measurement, the intensities around this region of interest differ quite a lot. I think that this random difference masks the potential effect of sample treatment and therefore I would like to somehow scale the signals in this region to the same level.
Basically, I guess I am looking for a version of autoscaling but for continous data, so that the intensities are relative.
Does anyone have some insights on how to do this?
Thank you!
Accepted Solutions

- Mark as New
- Bookmark
- Subscribe
- Mute
- Subscribe to RSS Feed
- Get Direct Link
- Report Inappropriate Content
Re: How can I "autoscale" functional / spectroscopic data?
Hi @Coffeelover,
Have you tried the Multiplicative Scatter Correction (MSC) command in the FDE tool? If you filter your X range to focus on the region of interest this may help:
Before

After


- Mark as New
- Bookmark
- Subscribe
- Mute
- Subscribe to RSS Feed
- Get Direct Link
- Report Inappropriate Content
Re: How can I "autoscale" functional / spectroscopic data?
If you have JMP Pro, have you tried Functional Data Explorer
- Mark as New
- Bookmark
- Subscribe
- Mute
- Subscribe to RSS Feed
- Get Direct Link
- Report Inappropriate Content
Re: How can I "autoscale" functional / spectroscopic data?
Yes, that's what I'm using, but haven't found a way of relativise the intensities across samples?
- Mark as New
- Bookmark
- Subscribe
- Mute
- Subscribe to RSS Feed
- Get Direct Link
- Report Inappropriate Content
Re: How can I "autoscale" functional / spectroscopic data?
Hi @Coffeelover,
Have you tried the Multiplicative Scatter Correction (MSC) command in the FDE tool? If you filter your X range to focus on the region of interest this may help:
Before
After
- Mark as New
- Bookmark
- Subscribe
- Mute
- Subscribe to RSS Feed
- Get Direct Link
- Report Inappropriate Content
Re: How can I "autoscale" functional / spectroscopic data?
Yes, that I will do. Thank you so much :)
Recommended Articles
- © 2026 JMP Statistical Discovery LLC. All Rights Reserved.
- Terms of Use
- Privacy Statement
- Contact Us