Turn on suggestions
Auto-suggest helps you quickly narrow down your search results by suggesting possible matches as you type.
- JMP Statement Regarding Critical PHP Remote Code Execution Vulnerabilities (CVE-2026-109618, CVE-2026-109619)
- Don’t miss your chance to experience Discovery Summit Europe at our best available rate! Early bird registration through 31 Oct.
- Graph Builder Toolbar streamlines interactive graphing. Creates shortcuts on Report and GraphBuilder Helpers toolbars. Download and install the extension.
Options
- Subscribe to RSS Feed
- Mark Topic as New
- Mark Topic as Read
- Float this Topic for Current User
- Bookmark
- Subscribe
- Mute
- Printer Friendly Page
Discussions
Solve problems, and share tips and tricks with other JMP users.- User Community
- :
- Discussions
- :
- How can I move the x-axis on top of graph?

Level I
- Mark as New
- Bookmark
- Subscribe
- Mute
- Subscribe to RSS Feed
- Get Direct Link
- Report Inappropriate Content
How can I move the x-axis on top of graph?
Nov 12, 2017 06:53 PM
(6199 views)
Hi, I'm trying to create a trace element concentration profile and need to have the x-axis (concentrations) at the top of the graph so that it can show how the concentration varies down-core .. Is there any way to do this?
2 REPLIES 2

Level X
- Mark as New
- Bookmark
- Subscribe
- Mute
- Subscribe to RSS Feed
- Get Direct Link
- Report Inappropriate Content
Re: How can I move the x-axis on top of graph?
Created:
Nov 13, 2017 04:13 AM
| Last Modified: Nov 13, 2017 1:14 AM
(6184 views)
| Posted in reply to message from maribliss 11-12-2017
If you run this script:
NamesDefaultToHere(1);
dt = Open("$SAMPLE_DATA/Big Class.jmp");
gb = dt << Graph Builder(
	Size( 528, 452 ),
	Show Control Panel( 0 ),
	Variables( X( :weight ), Y( :height ) ),
	Elements( Points( X, Y, Legend( 6 ) ) ),
	SendToReport(
		Dispatch(
			{},
			"weight",
			ScaleBox,
			{Label Row(
				{Inside Ticks( 1 ), Show Major Grid( 1 ), Show Minor Grid( 1 ),
				Show Minor Labels( 1 )}
			)}
		)
	)
);
it produces:
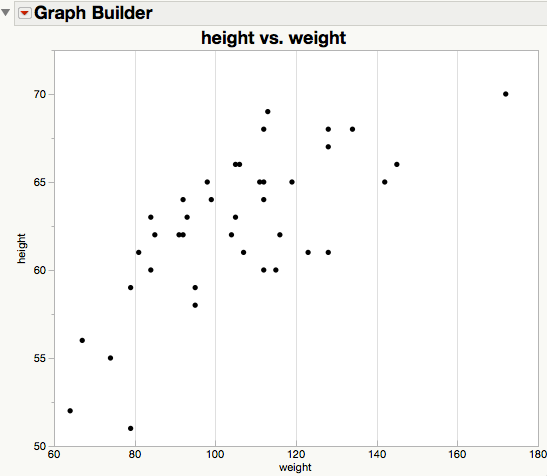
(which you could make interactively, of course).
I then did 'Edit > Journal' to make a Journal file, then used the 'fat plus' tool to move elements around to make:
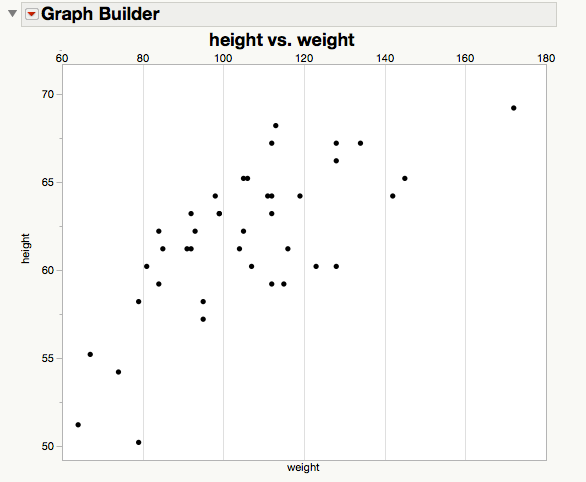


Super User (Alumni)
- Mark as New
- Bookmark
- Subscribe
- Mute
- Subscribe to RSS Feed
- Get Direct Link
- Report Inappropriate Content
Re: How can I move the x-axis on top of graph?
Finally we discover a reason why we might want to select the axes in isolation from the graph :)
-Dave
Recommended Articles
- © 2026 JMP Statistical Discovery LLC. All Rights Reserved.
- Terms of Use
- Privacy Statement
- Contact Us