- New to JMP? Let the Data Analysis Director guide you through selecting an analysis task, an analysis goal, and a data type. Available now in the JMP Marketplace!
- See how to install JMP Marketplace extensions to customize and enhance JMP.
- Subscribe to RSS Feed
- Mark Topic as New
- Mark Topic as Read
- Float this Topic for Current User
- Bookmark
- Subscribe
- Mute
- Printer Friendly Page
Discussions
Solve problems, and share tips and tricks with other JMP users.- JMP User Community
- :
- Discussions
- :
- Re: How can I create a variability menu using a current data table?
- Mark as New
- Bookmark
- Subscribe
- Mute
- Subscribe to RSS Feed
- Get Direct Link
- Report Inappropriate Content
How can I create a variability menu using a current data table?
I am looking to create a variability plot using a current data table. I would also like to have that data table beside the interactive plot so I can update the plot based on what I select. Any help would be greatly appreciated!
Accepted Solutions
- Mark as New
- Bookmark
- Subscribe
- Mute
- Subscribe to RSS Feed
- Get Direct Link
- Report Inappropriate Content
Re: How can I create a variability menu using a current data table?
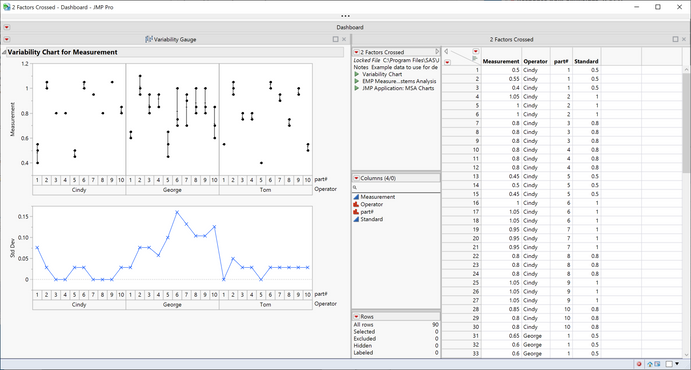
There seems to be confusion as to what exactly you are asking for. I'm not sure what you mean by creating a "variability menu", but below I have created a variability chart and then used JMP's dashboard functionality to create a combined window containing the chart and the data table. Is this the sort of thing you are trying to do?
If you, you can combine the chart and data table by selecting the windows using the checkboxes on the bottom right, then from the bottom right black triangle select 'combine windows'.
(the option for the variability chart is under analyze>quality & process>variability / attribute gauge chart)
or in code:
dt = open("$SAMPLE_DATA/Variability Data/2 factors crossed.jmp");

NewWindow("MY Window",
	HListBox(
		dt << Variability Chart(
			Y( :Measurement ),
			X( :Operator, :part# ),
			Standard( :Standard ),
			Automatic Recalc( 1 )
		),
		dg = dt << New Data Box()
	)
);
dg << close side panels ( 1 );- Mark as New
- Bookmark
- Subscribe
- Mute
- Subscribe to RSS Feed
- Get Direct Link
- Report Inappropriate Content
Re: How can I create a variability menu using a current data table?
I'm not sure what you mean by 'variability plot'...but the good old fashioned Distribution platform has a multitude of data visualization options where one can explore questions like:
1. Where's the middle?
2. How spread out is the data?
3. What does the shape of the distribution look like?
4. Is there anything odd/suspicious/out of the ordinary/unexpected?
Once you have a core plot(s) one option for selecting parts of the data for interactive playing around is to invoke a local data filter and explore with that.
- Mark as New
- Bookmark
- Subscribe
- Mute
- Subscribe to RSS Feed
- Get Direct Link
- Report Inappropriate Content
Re: How can I create a variability menu using a current data table?
There are videos that are quit nice and may help you to understand how a plot can be made in JMP to visualize data, find more in "Mastering JMP" section of this website. So beneath Distribution platform suggested by P_Bartell the Graph Builder may be a more general tool.
Understanding and Analyzing Information Using Graph Builder - JMP User Community
- Mark as New
- Bookmark
- Subscribe
- Mute
- Subscribe to RSS Feed
- Get Direct Link
- Report Inappropriate Content
Re: How can I create a variability menu using a current data table?
There seems to be confusion as to what exactly you are asking for. I'm not sure what you mean by creating a "variability menu", but below I have created a variability chart and then used JMP's dashboard functionality to create a combined window containing the chart and the data table. Is this the sort of thing you are trying to do?
If you, you can combine the chart and data table by selecting the windows using the checkboxes on the bottom right, then from the bottom right black triangle select 'combine windows'.
(the option for the variability chart is under analyze>quality & process>variability / attribute gauge chart)
or in code:
dt = open("$SAMPLE_DATA/Variability Data/2 factors crossed.jmp");

NewWindow("MY Window",
	HListBox(
		dt << Variability Chart(
			Y( :Measurement ),
			X( :Operator, :part# ),
			Standard( :Standard ),
			Automatic Recalc( 1 )
		),
		dg = dt << New Data Box()
	)
);
dg << close side panels ( 1 );- Mark as New
- Bookmark
- Subscribe
- Mute
- Subscribe to RSS Feed
- Get Direct Link
- Report Inappropriate Content
Re: How can I create a variability menu using a current data table?
Hi Dave, I should have been more specific. What you sent is very similar to what I am trying to achieve, thank you.
- Mark as New
- Bookmark
- Subscribe
- Mute
- Subscribe to RSS Feed
- Get Direct Link
- Report Inappropriate Content
Re: How can I create a variability menu using a current data table?
Out of interest, were you trying to do it interactively, or through code?
- Mark as New
- Bookmark
- Subscribe
- Mute
- Subscribe to RSS Feed
- Get Direct Link
- Report Inappropriate Content
Re: How can I create a variability menu using a current data table?
Through code
- Mark as New
- Bookmark
- Subscribe
- Mute
- Subscribe to RSS Feed
- Get Direct Link
- Report Inappropriate Content
Re: How can I create a variability menu using a current data table?
Quick example with graph builder (script from graph builders copy script to clipboard):
Graph Builder(
	Size(529, 451),
	Show Control Panel(0),
	Variables(X(:sex), Y(:height)),
	Elements(Box Plot(X, Y, Legend(3))),
	Column Switcher(:height, {:height, :weight})
)
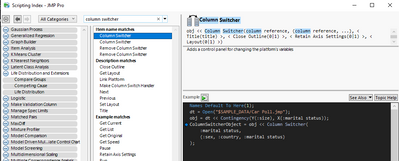
Scripting index entry:
Help page:
Scripting Guide > Data Tables > Columns > Add a Column Switcher
- Mark as New
- Bookmark
- Subscribe
- Mute
- Subscribe to RSS Feed
- Get Direct Link
- Report Inappropriate Content
Re: How can I create a variability menu using a current data table?
How can I select a column on the data tables filter and update that particular column to the Y axis on the plot?
- Mark as New
- Bookmark
- Subscribe
- Mute
- Subscribe to RSS Feed
- Get Direct Link
- Report Inappropriate Content
Re: How can I create a variability menu using a current data table?
Use Column Switcher for that
Recommended Articles
- © 2026 JMP Statistical Discovery LLC. All Rights Reserved.
- Terms of Use
- Privacy Statement
- Contact Us


