- Learn how to build custom Python data connectors and further customize JMP’s Data Connector Framework with the Python Data Connector Demo, available now in the JMP Marketplace!
- See how to move from signal modeling to system modeling at the first JMP Aerospace Analytics webinar. Register. June 18, 1 p.m. US Eastern Time.
- Subscribe to RSS Feed
- Mark Topic as New
- Mark Topic as Read
- Float this Topic for Current User
- Bookmark
- Subscribe
- Mute
- Printer Friendly Page
Discussions
Solve problems, and share tips and tricks with other JMP users.- JMP User Community
- :
- Discussions
- :
- Re: How I can I know if linear model or non-linear regression model fit to my va...

- Mark as New
- Bookmark
- Subscribe
- Mute
- Subscribe to RSS Feed
- Get Direct Link
- Report Inappropriate Content
How I can I know if linear model or non-linear regression model fit to my variables?
Hello,
I am a beginner user of JMP since I have recently finished the DOE course provided by Coursera. However, I have to use it in my project and so, I am trying to use JMP community forums to find my responses. But, in this case, I could not find the response that I am looking for.
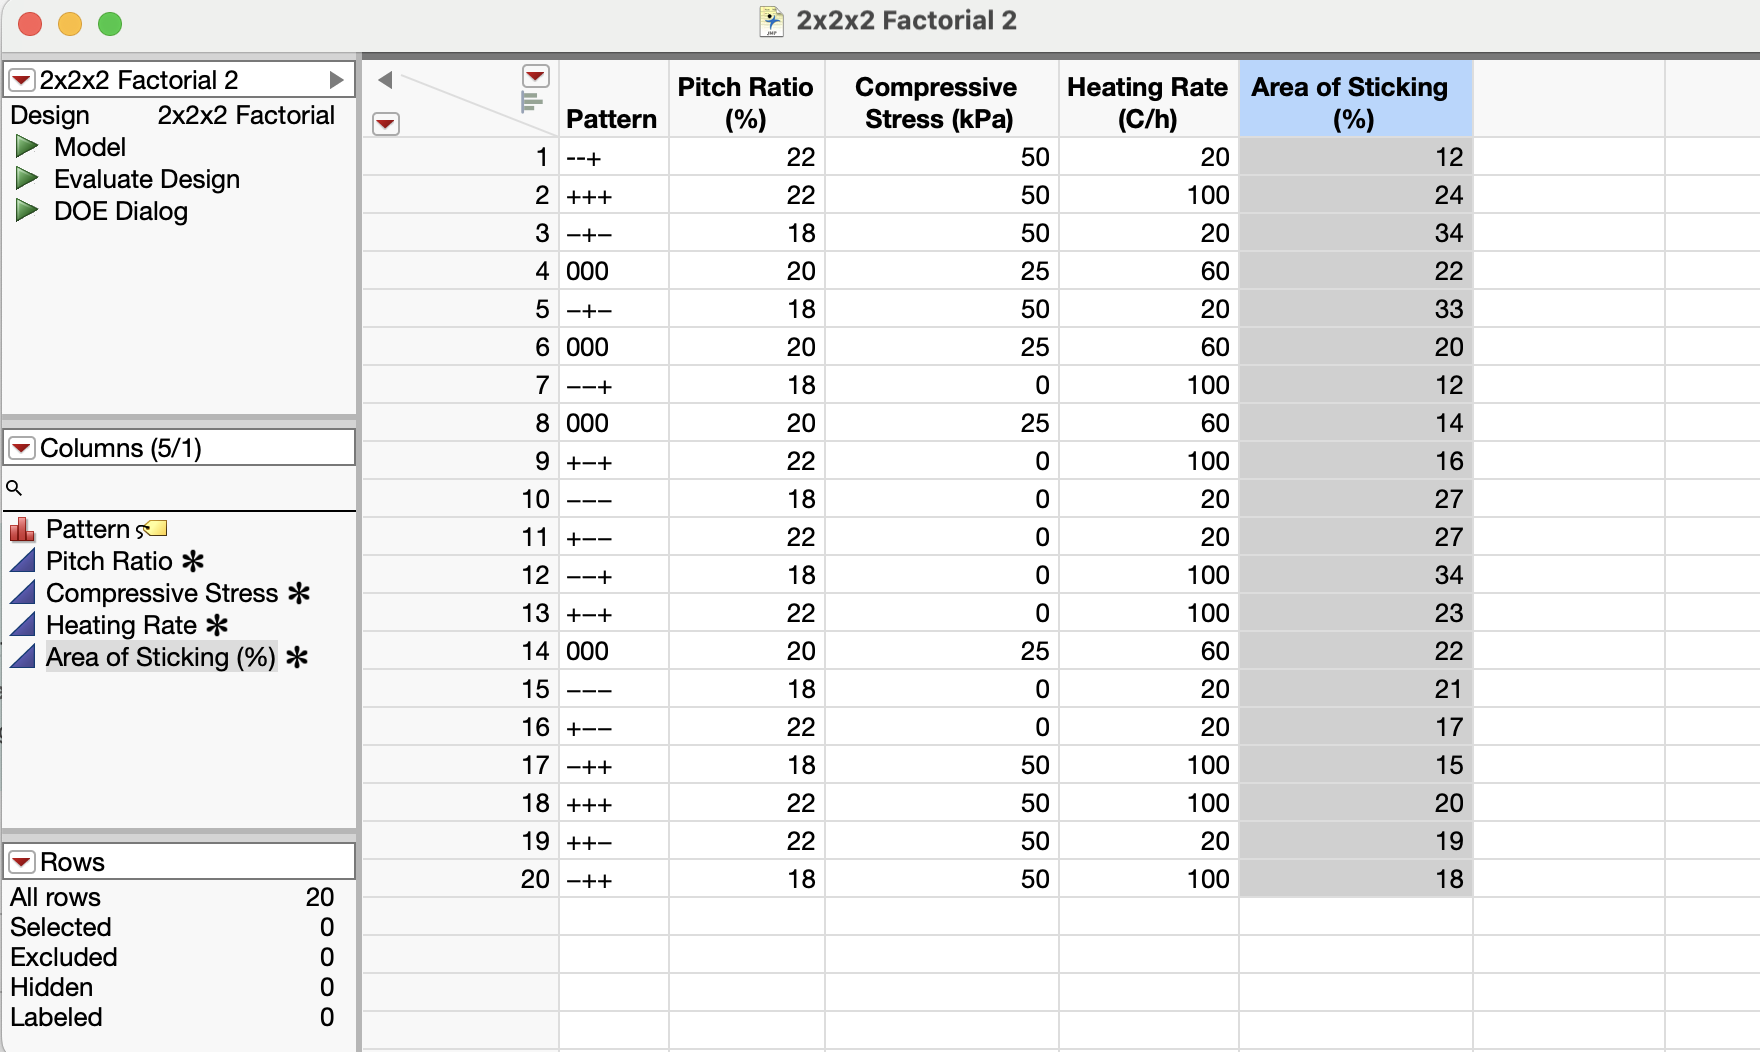
I have a 2-level full factorial design with 3 variables and with 2 center points. I considered 2 replicates and therefore, totally 20 runs. I made the data table with DOE > Classical > Full factorial design. For analyzing my data: Analyze > Fit model, Personality: Standard Least Squares, Emphasis: Effect Screening. My purpose was to know if my variables are fitted in a linear model or non-linear model? Because in Minitab, I think using "Analysis of Variance", the "quadratic term" shows if it is significance or not. I tried different Macros is JMP, but no one shows any sign of linearity or non-linearity as I knew.
JMP, Version 17.2.0 (701896)
Kindly I attached screenshots of my data table and fit model.
I would appreciate it if you help me in this case.
Thank you,
Nafiseh
Accepted Solutions

- Mark as New
- Bookmark
- Subscribe
- Mute
- Subscribe to RSS Feed
- Get Direct Link
- Report Inappropriate Content
Re: How I can I know if linear model or non-linear regression model fit to my variables?
Hello @Nafis1991,
Ok, the values for the response make a lot more sense now and I'm able to reproduce your results. So based on these values and on your questions, I think you might be interested in general on how to validate your regression model, and what to take care of. There are great ressources about this topic to dive deeper :
- JMP Statistics Knowledge Portal : Regression Model Assumptions | Introduction to Statistics | JMP
- "Correlation and Regression" module on course Statistical Thinking for Industrial Problem Solving : Correlation and Regression Tutorial | JMP
- Analyzing Residuals and Outliers - JMP User Community and Multiple Regression Residual Analysis and Outliers | Introduction to Statistics | JMP
To check your model fit and assumptions, you can take a look at :
- Linear relationship between variables and response : Looking at the "Residual by Predicted Plot", there is no obvious pattern showing a non-linearity in the residuals (constant variance, approximately normally distributed (with a mean of zero), and independent of one another) :
- Normal distribution of errors : You can also check normality of the residuals with the plot Residual Normal Quantile Plot (accessible through red triangle, "Row Diagnostics", "Plot Residuals by Normal Quantiles"). Again, you don't have in your example an obvious pattern or strong deviation from normal :
- Homoscedasticity of errors : You can check this assumption with the "Residual by Predicted Plot" seen earlier. In your case, there is no evident sign of heteroscedasticity.
- Independence of the observations : There might be several ways to check for correlations or multicollinearity in your data. You can use the platform Multivariate (accessible in menu Analyze, Multivariate Methods, Multivariate) to check if you have correlations between your factors. As your data was generated by a DoE without any constraints or covariables, you have perfectly independent factors without any correlations :
You can also check multicollinearity by displaying Variance Inflation Factor (VIF) of the terms in your model : go into the "Parameter Estimates" panel, right click on the table displaying results, click on "Columns", and then choose "VIF". High VIFs indicate a collinearity issue among the terms in the model. While multicollinearity does not reduce a model's overall predictive power, it can produce estimates of the regression coefficients that are not statistically significant, as the inputs are not independent. In your case, nothing to worry about, VIFs are equal to 1, so effect terms are not correlated :


As mentioned earlier, the Lack of Fit test can be helpful to assess if your model fits the data well or not. If not (indicated by a statistically significant p-value), this may be an indication that a term could be missing in the model (like an higher order term, interaction or quadratic effect), or that some terms might have incorrectly been added in the model.
There are several metrics and statistics helping you assess if your model seems reliable and relevant, depending on your objective : Statistical significance of the model (Analysis of Variance (jmp.com)), Summary of Fit (with R², R² adjusted, RMSE), and possibly other indicators accessible through other platforms (like Information criteria with Generalized Regression platform)...
"All models are wrong, but some are useful" (George E. P. Box) :
Note that you can find several equally fitting models, so using Domain Expertise in combination with Statistics can help you compare and select the most interesting model(s). Just for illustration, I have saved 2 scripts in your datatable showing 2 similar but different models (with their prediction formula added in the table):
- "Fit Least Squares Area of Sticking 2 [Full Model]" : Model with all terms (main effects, 2-factors interactions and one 3-factors interaction).
- "Fit Least Squares Area of Sticking 2 [Reduced Model 1]" : Model with all main effects and 2-factors interactions. No 3-factors interaction.
You can see that results from these two models are very similar, so domain expertise can help you sort out the models, or you could continue with the two models (or more).
Hope this (long) answer will answer your questions (and probably more),
"It is not unusual for a well-designed experiment to analyze itself" (Box, Hunter and Hunter)
- Mark as New
- Bookmark
- Subscribe
- Mute
- Subscribe to RSS Feed
- Get Direct Link
- Report Inappropriate Content
Re: How I can I know if linear model or non-linear regression model fit to my variables?
Hi @Nafis1991,
Welcome in the Community !
I'm a bit surprised by the screenshot of your model fitting because with the data you provide I don't seem to have the same output :

It seems the statistical significance of the terms in the model is somehow reversed compared to what you obtained ? I am not able to find similar results as you have. Has the table changed between the file you send and the screenshot you send ?
Concerning your direct question about "non-linearity" :
- As you have included replicated centre points and your model is not saturated, you are able to perform a Lack-Of-Fit test (as shown in your screenshot as well), to assess whether the model fits the data well. Both in your model and the one I find you can see that the p-value for this test is quite high, so there is not statistical significant evidence that your model is not adequate for the data you have collected. So there is no indication at this stage that you should add quadratic effect(s) in your model.
- You can also take a look at residuals to see if you can spot some patterns. If a quadratic effect would be missing in the model, you can expect to see a curvilinear behaviour on the residuals. On your example, there is no obvious pattern :
- To also assess if your model seems to fit the data well, I would emphasize on the value of visualisations. For example, the "Actual vs. Predicted" plot (available under the red triangle, "Row Diagnostics", "Plot Actual by Predicted") offers a very easy way to assess the relevance of your model :
Depending on the repartition of your point around the line of fit and the confidence intervals, you can assess the relevance and significance of the model : Effect Leverage Plots (jmp.com)


I share the file with the added script "Fit Least Squares" so that you can see the options I have described here, and start investigating why the outcomes are different on same data and model.
I also added a new response column "Area of Sticking (formula)" based on your outputs to create data that could closely match what you obtain. So even if there was a problem in the data collection/recording, you can fit a model using this column to have close results compared to what you have (script "Fit Least Squares Area of Sticking (formula)").
I hope this first answer will help you,
"It is not unusual for a well-designed experiment to analyze itself" (Box, Hunter and Hunter)
- Mark as New
- Bookmark
- Subscribe
- Mute
- Subscribe to RSS Feed
- Get Direct Link
- Report Inappropriate Content
Re: How I can I know if linear model or non-linear regression model fit to my variables?
Hello Victor,
Thank you for your comprehensive explanation.
Sorry, the screenshot about my data table was wrong. But the .jmp file was correct. Because first I tried to attached both files for data table and the analysis, but I could only attach data table. So, please don't consider the previous screen shot about my data table.
- Mark as New
- Bookmark
- Subscribe
- Mute
- Subscribe to RSS Feed
- Get Direct Link
- Report Inappropriate Content
Re: How I can I know if linear model or non-linear regression model fit to my variables?
Hello @Nafis1991,
Ok, the values for the response make a lot more sense now and I'm able to reproduce your results. So based on these values and on your questions, I think you might be interested in general on how to validate your regression model, and what to take care of. There are great ressources about this topic to dive deeper :
- JMP Statistics Knowledge Portal : Regression Model Assumptions | Introduction to Statistics | JMP
- "Correlation and Regression" module on course Statistical Thinking for Industrial Problem Solving : Correlation and Regression Tutorial | JMP
- Analyzing Residuals and Outliers - JMP User Community and Multiple Regression Residual Analysis and Outliers | Introduction to Statistics | JMP
To check your model fit and assumptions, you can take a look at :
- Linear relationship between variables and response : Looking at the "Residual by Predicted Plot", there is no obvious pattern showing a non-linearity in the residuals (constant variance, approximately normally distributed (with a mean of zero), and independent of one another) :
- Normal distribution of errors : You can also check normality of the residuals with the plot Residual Normal Quantile Plot (accessible through red triangle, "Row Diagnostics", "Plot Residuals by Normal Quantiles"). Again, you don't have in your example an obvious pattern or strong deviation from normal :
- Homoscedasticity of errors : You can check this assumption with the "Residual by Predicted Plot" seen earlier. In your case, there is no evident sign of heteroscedasticity.
- Independence of the observations : There might be several ways to check for correlations or multicollinearity in your data. You can use the platform Multivariate (accessible in menu Analyze, Multivariate Methods, Multivariate) to check if you have correlations between your factors. As your data was generated by a DoE without any constraints or covariables, you have perfectly independent factors without any correlations :
You can also check multicollinearity by displaying Variance Inflation Factor (VIF) of the terms in your model : go into the "Parameter Estimates" panel, right click on the table displaying results, click on "Columns", and then choose "VIF". High VIFs indicate a collinearity issue among the terms in the model. While multicollinearity does not reduce a model's overall predictive power, it can produce estimates of the regression coefficients that are not statistically significant, as the inputs are not independent. In your case, nothing to worry about, VIFs are equal to 1, so effect terms are not correlated :
As mentioned earlier, the Lack of Fit test can be helpful to assess if your model fits the data well or not. If not (indicated by a statistically significant p-value), this may be an indication that a term could be missing in the model (like an higher order term, interaction or quadratic effect), or that some terms might have incorrectly been added in the model.
There are several metrics and statistics helping you assess if your model seems reliable and relevant, depending on your objective : Statistical significance of the model (Analysis of Variance (jmp.com)), Summary of Fit (with R², R² adjusted, RMSE), and possibly other indicators accessible through other platforms (like Information criteria with Generalized Regression platform)...
"All models are wrong, but some are useful" (George E. P. Box) :
Note that you can find several equally fitting models, so using Domain Expertise in combination with Statistics can help you compare and select the most interesting model(s). Just for illustration, I have saved 2 scripts in your datatable showing 2 similar but different models (with their prediction formula added in the table):
- "Fit Least Squares Area of Sticking 2 [Full Model]" : Model with all terms (main effects, 2-factors interactions and one 3-factors interaction).
- "Fit Least Squares Area of Sticking 2 [Reduced Model 1]" : Model with all main effects and 2-factors interactions. No 3-factors interaction.
You can see that results from these two models are very similar, so domain expertise can help you sort out the models, or you could continue with the two models (or more).
Hope this (long) answer will answer your questions (and probably more),
"It is not unusual for a well-designed experiment to analyze itself" (Box, Hunter and Hunter)
- Mark as New
- Bookmark
- Subscribe
- Mute
- Subscribe to RSS Feed
- Get Direct Link
- Report Inappropriate Content
Re: How I can I know if linear model or non-linear regression model fit to my variables?
Recommended Articles
- © 2026 JMP Statistical Discovery LLC. All Rights Reserved.
- Terms of Use
- Privacy Statement
- Contact Us