- Learn how to build custom Python data connectors and further customize JMP’s Data Connector Framework with the Python Data Connector Demo, available now in the JMP Marketplace!
- See how to create experiments to support product design and ID useful product features. Register for June 12 webinar, 2pm US Eastern Time.
- Subscribe to RSS Feed
- Mark Topic as New
- Mark Topic as Read
- Float this Topic for Current User
- Bookmark
- Subscribe
- Mute
- Printer Friendly Page
Discussions
Solve problems, and share tips and tricks with other JMP users.- JMP User Community
- :
- Discussions
- :
- Re: Histogram Distribution to Fitted Line Only

- Mark as New
- Bookmark
- Subscribe
- Mute
- Subscribe to RSS Feed
- Get Direct Link
- Report Inappropriate Content
Histogram Distribution to Fitted Line Only
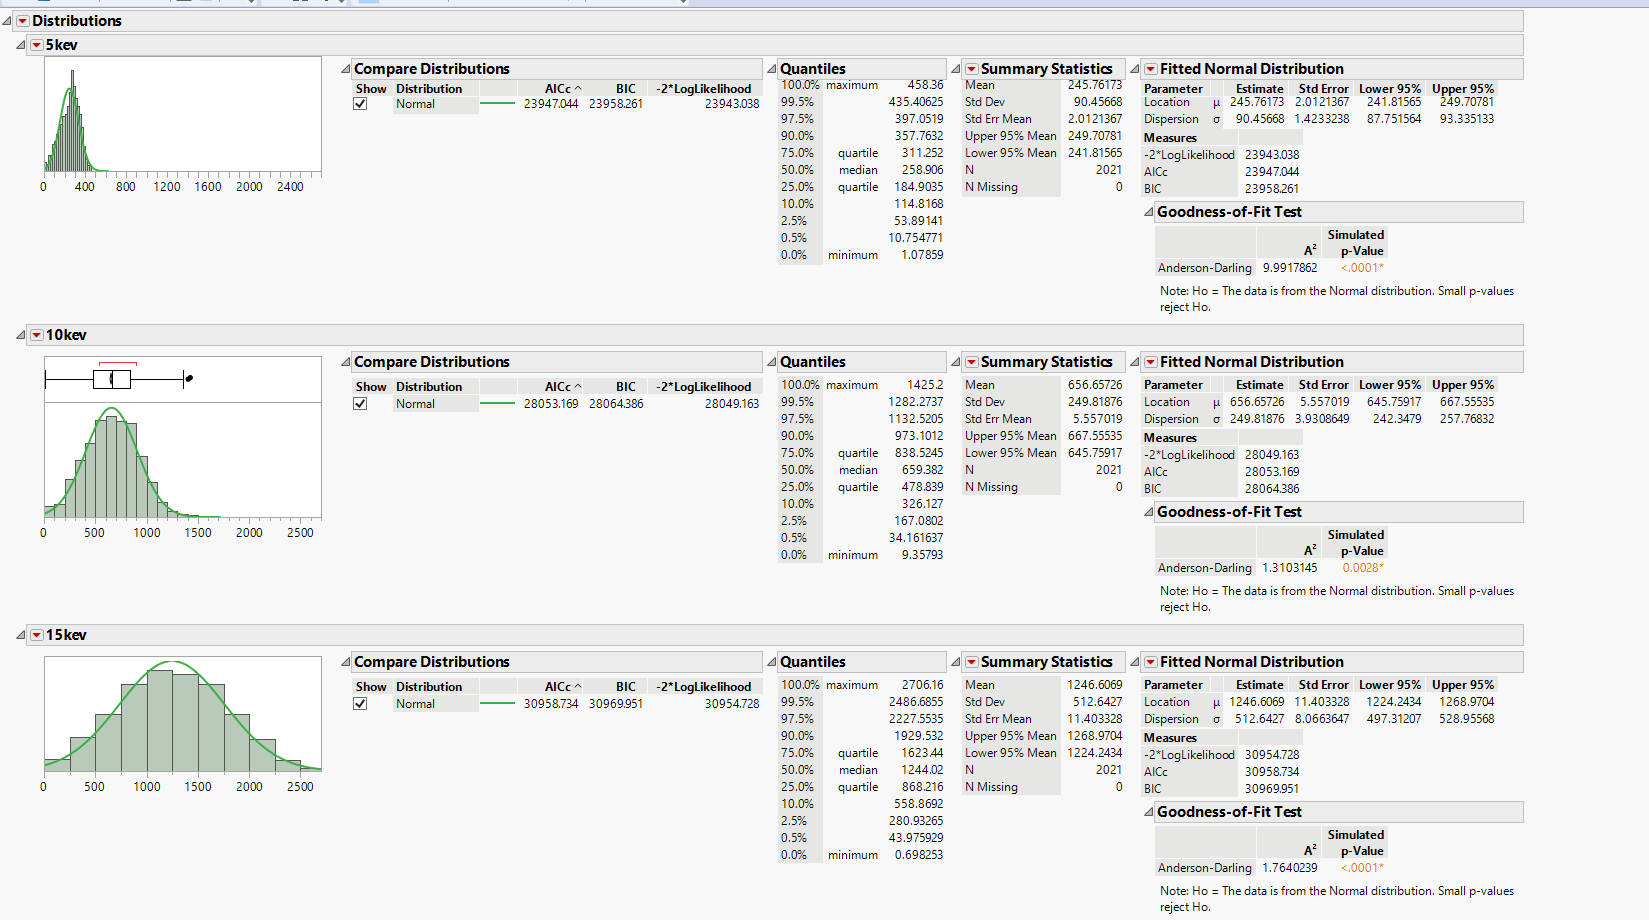
I have 3 separate histograms displaying z-depth data, generated via 'Distribution' for different data sets I'm looking to compare. I've fixed the x range to be 0 to 2500 so I can compare better. I've fitted each with a normal continuous curve. I would like to now create a 4th plot of those 3 normal curves.
Under the red pull down tab of the 'Fitted Normal Distribution' I see there's an option to save into a new column the density formula (also the distribution or the simulation formula). It than populates a new column with corresponding densities for every point. This next part is where I think I'm going wrong. I plot the density (y-axis) vs row number.
(I did not the fit is not significant this is more as just a visual).

- Mark as New
- Bookmark
- Subscribe
- Mute
- Subscribe to RSS Feed
- Get Direct Link
- Report Inappropriate Content
Re: Histogram Distribution to Fitted Line Only
Are you trying to compare densities to each other or something else? You can do that for example by using Fit Y By X (you might have to stack your data first)


- Mark as New
- Bookmark
- Subscribe
- Mute
- Subscribe to RSS Feed
- Get Direct Link
- Report Inappropriate Content
Re: Histogram Distribution to Fitted Line Only
Graph Builder does a pretty nice job with data like this

All the measurements need to be in one column and the categories need to be in another (stacked format)
Histogram Style dropdown is set to kernel density
- Mark as New
- Bookmark
- Subscribe
- Mute
- Subscribe to RSS Feed
- Get Direct Link
- Report Inappropriate Content
Re: Histogram Distribution to Fitted Line Only
That works! Can I scale the counts some how? I scaled 10ekV and 15ekV relative to 5ekV by doubling and tripling the data, respectively, but I'm wanting to add another data set for 2.5ekV that would require me to divide counts so my method wont work.
Thanks!
Recommended Articles
- © 2026 JMP Statistical Discovery LLC. All Rights Reserved.
- Terms of Use
- Privacy Statement
- Contact Us