- Subscribe to RSS Feed
- Mark Topic as New
- Mark Topic as Read
- Float this Topic for Current User
- Bookmark
- Subscribe
- Mute
- Printer Friendly Page
Discussions
Solve problems, and share tips and tricks with other JMP users.- JMP User Community
- :
- Discussions
- :
- Hiding Legend Items in Graph Builder using JSL
- Mark as New
- Bookmark
- Subscribe
- Mute
- Subscribe to RSS Feed
- Get Direct Link
- Report Inappropriate Content
Hiding Legend Items in Graph Builder using JSL
I am having an annoying issue with the Graph Builder in JSL. In order to show both the points and a smoother on a scatter plot I am changing the trasnparency of the points. I can make this work well enough but when I manipulate the plot later in JSL the points are being added back to the legend by default instead of staying hidden I assume because JMP thinks they are no longer redundant. I know manually in the graph builder you can uncheck items that you don't want to display but is there a way to do this in JSL?
Accepted Solutions
- Mark as New
- Bookmark
- Subscribe
- Mute
- Subscribe to RSS Feed
- Get Direct Link
- Report Inappropriate Content
Re: Hiding Legend Items in Graph Builder using JSL
I found an alternate solution that in my view is cleaner then Jim's brute force method.
Instead I am defining two lists at the beginning of my function:
	p = {};
	l = {};
	summarize(unique_values=by(OverlayCol));
	NSplits = N Items (unique_values);

	For(i=0, i < NSplits, i+=1,
		p = Insert(p, -1);
		l = Insert(l, i);
	);
	pl = Insert(p, l);
to create the two lists needed for the points and lines (in my case) legend items then passing those lists as matrices that into the graph builder dispatch as follows:
			Dispatch(
				{},
				"400",
				LegendBox,
				{Legend Position( {3, Matrix(p), 9, Matrix(l)} ),
				Position( Matrix(pl))}
			)
Full version of the updated function:
RadPlotCreator1XGroupTest = Function({dt, XCol, YCol, OverlayCol, GroupXCol}, {Default Local},

	p = {};
	l = {};
	summarize(unique_values=by(OverlayCol));
	NSplits = N Items (unique_values);

	For(i=0, i < NSplits, i+=1,
		p = Insert(p, -1);
		l = Insert(l, i);
	);
	pl = Insert(p, l);


	gb =  dt << Graph Builder(
		Size( 849, 622 ),
		Fit to Window( "Off" ),
		Show Control Panel(0),
		Grid Color( "Black" ),
		Variables(
			X( XCol ),
			Y( YCol ),
			Group X( GroupXCol ),
			Overlay( OverlayCol )
		),
		Elements(Points(X, Y, Legend(3)), Smoother( X, Y, Legend( 9 ) )),
		SendToReport(
			Dispatch(
				{},
				"",
				ScaleBox,
				{}
			),
			Dispatch(
				{},
				"",
				ScaleBox,
				{}
			),
			Dispatch(
				{},
				"400",
				LegendBox,
				{Legend Position( {3, Matrix(p), 9, Matrix(l)} ),
				Position( Matrix(pl))}
			)
		)
	);


	sb = report(gb)[ScaleBox(5)];
	For(i=0, i < NSplits, i+=1,
		sb << Legend Model(3, Properties(i, {Transparency(0.2)}));
	);

	frame_list = gb << xpath("//FrameBox");
	num_frames = N Items (frame_list);


	For(i=1, i <= num_frames, i+=1,
			Report(gb)[Framebox(i)] << Background Color(White);
			Report(gb)[Framebox(i)] << Grid Line Order( Back );
			Report(gb)[Framebox(i)] << Reference Line Order( Back );
			Report(gb)[Framebox(i)] << Frame Size(250, 250);
			Report(gb)[Framebox(i)] << X Axis(0, 150, Inc(20), Minor Ticks(1),
				Add Ref Line( 70, Solid, "Black", "", 2 ),
				Add Ref Line( 120, Solid, "Black", "", 2 ),
				Add Ref Line( 135, Solid, "Black", "", 2 ), Show Major Grid( 1 ));
			Report(gb)[Framebox(i)] << Y Axis(Minor Ticks(1));
	);

	gbp = Report( gb );
	img = gbp << getpicture();

	return(img);

);
- Mark as New
- Bookmark
- Subscribe
- Mute
- Subscribe to RSS Feed
- Get Direct Link
- Report Inappropriate Content
Re: Hiding Legend Items in Graph Builder using JSL
I guess there is no JSL solution for this. If that is the case there very much should be.
- Mark as New
- Bookmark
- Subscribe
- Mute
- Subscribe to RSS Feed
- Get Direct Link
- Report Inappropriate Content
Re: Hiding Legend Items in Graph Builder using JSL
Hi everyone,
I am currently facing the same problem: hiding a part of the Graph Builder legend using JSL.
I think the options "Legend" or "Legend position" could help but I have difficulties to fully understand how it works, in particular if we do not know the number of groups.
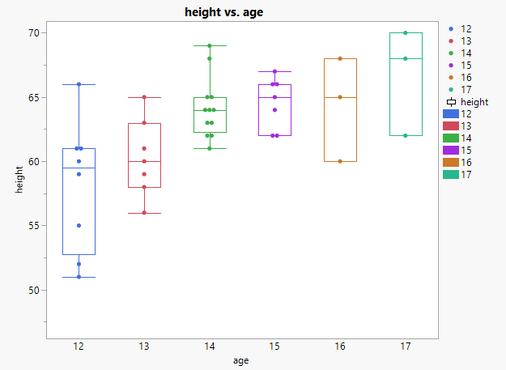
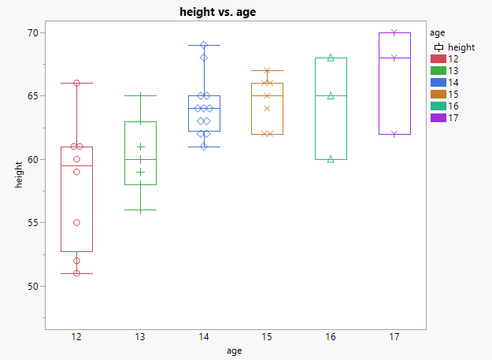
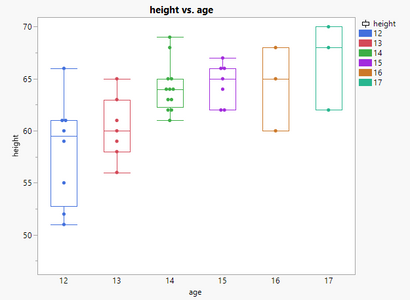
For instance I want to create this kind of graph using the Big Class table, and I do not want to display the point items in the legend:
The corresponding script is:
Graph Builder(
	Size( 528, 450 ),
	Show Control Panel( 0 ),
	Variables( X( :age ), Y( :height ), Color( :age ) ),
	Elements( Box Plot( X, Y, Legend( 4 ) ), Points( X, Y, Legend( 5 ) ) ),
	SendToReport(
		Dispatch(
			{},
			"400",
			LegendBox,
			{Legend Position(
				{4, [0, 1, 2, 3, 4, 5, 6, -3], 5, [-1, -1, -1, -1, -1, -1]}
			), Position( {0, 1, 2, 3, 4, 5, 6, -3, -1, -1, -1, -1, -1, -1} )}
		)
	)
)
Is there a way to generalize the process without knowing the number of levels for the age variable?
Any input would be appreciated :) Thanks
- Mark as New
- Bookmark
- Subscribe
- Mute
- Subscribe to RSS Feed
- Get Direct Link
- Report Inappropriate Content
Re: Hiding Legend Items in Graph Builder using JSL
You can use the Show Legend element to control the showing or hiding of the Legend. Here is the entry from the Scripting Index showing it
Help==>Scripting Index
You can also delete the entire Legend component by deleting it using the Display Tree capabilites in JMP
gb = Graph Builder(
	Size( 528, 450 ),
	Show Control Panel( 0 ),
	Variables( X( :age ), Y( :height ), Color( :age ) ),
	Elements( Box Plot( X, Y))
);
report(gb)[LegendBox(1)]<<delete;
- Mark as New
- Bookmark
- Subscribe
- Mute
- Subscribe to RSS Feed
- Get Direct Link
- Report Inappropriate Content
Re: Hiding Legend Items in Graph Builder using JSL
Hi @txnelson,
Thanks for your reply.
However I do not want to completely hide or delete the legend but just a part of it.
By default I have the following graph:
And I would like to hide only the point items in the legend to get that one:
Apparently "-1" in the legend position option means "hide this item" but I do not see how to easily use this option without prior information about the graph.
I hope it is clearer.
- Mark as New
- Bookmark
- Subscribe
- Mute
- Subscribe to RSS Feed
- Get Direct Link
- Report Inappropriate Content
Re: Hiding Legend Items in Graph Builder using JSL
What version of JMP are you using, and on which operating system. Using the JSL you provided, I can not get results like you are specifying. For JMP 15 I get
In JMP 13 and JMP 14 I get:
In JMP 11 and JMP 12, I get:
But I can not get the graph you present with the different markers, and both the points and the rectangular marking in the legend.
- Mark as New
- Bookmark
- Subscribe
- Mute
- Subscribe to RSS Feed
- Get Direct Link
- Report Inappropriate Content
Re: Hiding Legend Items in Graph Builder using JSL
I personally get the dual legends in both JMP 12 and JMP 14. I didn't post my code earlier but below is the function I use to make the plots where I have the issue. In my case I believe what is happening is that as soon as I use the bit of code to set the transparency of the points that JMP no longer thinks the points legend item is redundant and displays the result.
RadPlotCreator1X1YGroup = Function({dt, XCol, YCol, OverlayCol, GroupXCol, GroupYCol}, {Default Local},

	gb =  dt << Graph Builder(
		Size( 849, 622 ),
		Fit to Window( "Off" ),
		Show Control Panel(0),
		Grid Color( "Black" ),
		Variables(
			X( XCol ),
			Y( YCol ),
			Group X( GroupXCol ),
			Group Y( GroupYCol ),
			Overlay( OverlayCol )
		),
		Elements(Points(X, Y, Legend(3)), Smoother( X, Y, Legend( 9 ) )),
		SendToReport(
			Dispatch(
				{},
				"",
				ScaleBox,
				{}
			),
			Dispatch(
				{},
				"",
				ScaleBox,
				{}
			)
		)
	);

	summarize(unique_values=by(OverlayCol));
	NSplits = N Items (unique_values);
	sb = report(gb)[ScaleBox(5)];
	For(i=0, i < NSplits, i+=1,
		sb << Legend Model(3, Properties(i, {Transparency(0.2)}));
	);

	frame_list = gb << xpath("//FrameBox");
	num_frames = N Items (frame_list);


	For(i=1, i <= num_frames, i+=1,
			Report(gb)[Framebox(i)] << Background Color(White);
			Report(gb)[Framebox(i)] << Grid Line Order( Back );
			Report(gb)[Framebox(i)] << Reference Line Order( Back );
			Report(gb)[Framebox(i)] << Frame Size(250, 250);
			Report(gb)[Framebox(i)] << X Axis(0, 150, Inc(20), Minor Ticks(1),
				Add Ref Line( 70, Solid, "Black", "", 2 ),
				Add Ref Line( 120, Solid, "Black", "", 2 ),
				Add Ref Line( 135, Solid, "Black", "", 2 ), Show Major Grid( 1 ));
			Report(gb)[Framebox(i)] << Y Axis(Minor Ticks(1));
	);

	gbp = Report( gb );
	img = gbp << getpicture();

	return(img);

);- Mark as New
- Bookmark
- Subscribe
- Mute
- Subscribe to RSS Feed
- Get Direct Link
- Report Inappropriate Content
Re: Hiding Legend Items in Graph Builder using JSL
Ooops wrong copy / paste sorry for the confusion!
Let's redo it (using JMP15)!
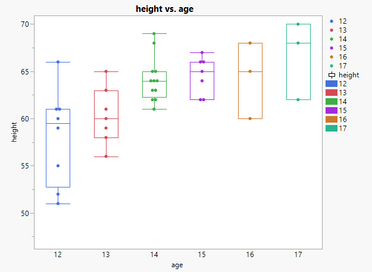
First I have the following graph:
And the corresponding script is:
Graph Builder(
	Variables( X( :age ), Y( :height ), Color( :age ) ),
	Elements( Points( X, Y, Legend( 6 ) ), Box Plot( X, Y, Legend( 7 ) ) )
)
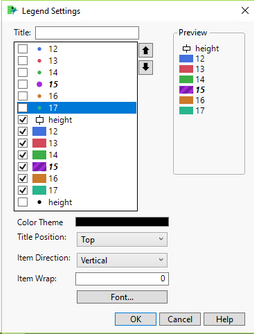
Manually I modify the legend and deselect items associated with the points:
I get this graph:
And the updated script is:
Graph Builder(
	Variables( X( :age ), Y( :height ), Color( :age ) ),
	Elements( Points( X, Y, Legend( 6 ) ), Box Plot( X, Y, Legend( 7 ) ) ),
	SendToReport(
		Dispatch(
			{},
			"400",
			LegendBox,
			{Legend Position(
				{6, [-1, -1, -1, -1, -1, -1], 7, [0, 1, 2, 3, 4, 5, 6, -3]}
			), Position( {-1, -1, -1, -1, -1, -1, 0, 1, 2, 3, 4, 5, 6, -3} )}
		)
	)
)
Is there an easy way to manage this second step with JSL?
- Mark as New
- Bookmark
- Subscribe
- Mute
- Subscribe to RSS Feed
- Get Direct Link
- Report Inappropriate Content
Re: Hiding Legend Items in Graph Builder using JSL
Here is the brute force way that I use to solve these kind of issues. I simply build the JSL code required and then run the JSL I created. Please note that in the Big Class data table I used, I added an additional Age Group, of 18.
Names Default To Here( 1 );
dt = Current Data Table();

// Find the number of Age groups
Summarize( dt, ageGroups = by( :age ) );

// Build the JSL
theExpr =
"Graph Builder(
	Show Control Panel( 0 ),
	Variables( X( :age ), Y( :height ), Color( :age ) ),
	Elements( Points( X, Y, Legend( 6 ) ), Box Plot( X, Y, Legend( 7 ) ) ),
	SendToReport(
		Dispatch(
			{},
			\!"400\!",
			LegendBox,
			{Legend Position(
				{6, [ -1";

For( i = 2, i <= N Items( ageGroups ), i++,
	theExpr = theExpr || ", -1"
);

theExpr = theExpr || "], 7, [0";

For( i = 1, i <= N Items( ageGroups ), i++,
	theExpr = theExpr || ", " || Char( i )
);

theExpr = theExpr || ", -3]}
	), Position( {-1";

For( i = 2, i <= N Items( ageGroups ), i++,
	theExpr = theExpr || ", -1"
);

For( i = 0, i <= N Items( ageGroups ), i++,
	theExpr = theExpr || ", " || Char( i )
);

theExpr = theExpr || ", -3]} ) } )));";

// Execute the JSL string
eval(parse(theExpr));
- Mark as New
- Bookmark
- Subscribe
- Mute
- Subscribe to RSS Feed
- Get Direct Link
- Report Inappropriate Content
Re: Hiding Legend Items in Graph Builder using JSL
I found an alternate solution that in my view is cleaner then Jim's brute force method.
Instead I am defining two lists at the beginning of my function:
	p = {};
	l = {};
	summarize(unique_values=by(OverlayCol));
	NSplits = N Items (unique_values);

	For(i=0, i < NSplits, i+=1,
		p = Insert(p, -1);
		l = Insert(l, i);
	);
	pl = Insert(p, l);
to create the two lists needed for the points and lines (in my case) legend items then passing those lists as matrices that into the graph builder dispatch as follows:
			Dispatch(
				{},
				"400",
				LegendBox,
				{Legend Position( {3, Matrix(p), 9, Matrix(l)} ),
				Position( Matrix(pl))}
			)
Full version of the updated function:
RadPlotCreator1XGroupTest = Function({dt, XCol, YCol, OverlayCol, GroupXCol}, {Default Local},

	p = {};
	l = {};
	summarize(unique_values=by(OverlayCol));
	NSplits = N Items (unique_values);

	For(i=0, i < NSplits, i+=1,
		p = Insert(p, -1);
		l = Insert(l, i);
	);
	pl = Insert(p, l);


	gb =  dt << Graph Builder(
		Size( 849, 622 ),
		Fit to Window( "Off" ),
		Show Control Panel(0),
		Grid Color( "Black" ),
		Variables(
			X( XCol ),
			Y( YCol ),
			Group X( GroupXCol ),
			Overlay( OverlayCol )
		),
		Elements(Points(X, Y, Legend(3)), Smoother( X, Y, Legend( 9 ) )),
		SendToReport(
			Dispatch(
				{},
				"",
				ScaleBox,
				{}
			),
			Dispatch(
				{},
				"",
				ScaleBox,
				{}
			),
			Dispatch(
				{},
				"400",
				LegendBox,
				{Legend Position( {3, Matrix(p), 9, Matrix(l)} ),
				Position( Matrix(pl))}
			)
		)
	);


	sb = report(gb)[ScaleBox(5)];
	For(i=0, i < NSplits, i+=1,
		sb << Legend Model(3, Properties(i, {Transparency(0.2)}));
	);

	frame_list = gb << xpath("//FrameBox");
	num_frames = N Items (frame_list);


	For(i=1, i <= num_frames, i+=1,
			Report(gb)[Framebox(i)] << Background Color(White);
			Report(gb)[Framebox(i)] << Grid Line Order( Back );
			Report(gb)[Framebox(i)] << Reference Line Order( Back );
			Report(gb)[Framebox(i)] << Frame Size(250, 250);
			Report(gb)[Framebox(i)] << X Axis(0, 150, Inc(20), Minor Ticks(1),
				Add Ref Line( 70, Solid, "Black", "", 2 ),
				Add Ref Line( 120, Solid, "Black", "", 2 ),
				Add Ref Line( 135, Solid, "Black", "", 2 ), Show Major Grid( 1 ));
			Report(gb)[Framebox(i)] << Y Axis(Minor Ticks(1));
	);

	gbp = Report( gb );
	img = gbp << getpicture();

	return(img);

);
Recommended Articles
- © 2026 JMP Statistical Discovery LLC. All Rights Reserved.
- Terms of Use
- Privacy Statement
- Contact Us


