- Due to inclement weather, JMP support response times may be slower than usual during the week of January 26.
To submit a request for support, please send email to support@jmp.com.
We appreciate your patience at this time. - Register to see how to import and prepare Excel data on Jan. 30 from 2 to 3 p.m. ET.
- Subscribe to RSS Feed
- Mark Topic as New
- Mark Topic as Read
- Float this Topic for Current User
- Bookmark
- Subscribe
- Mute
- Printer Friendly Page
Discussions
Solve problems, and share tips and tricks with other JMP users.- JMP User Community
- :
- Discussions
- :
- Help doing a table transform and converting a timestamp?
- Mark as New
- Bookmark
- Subscribe
- Mute
- Subscribe to RSS Feed
- Get Direct Link
- Report Inappropriate Content
Help doing a table transform and converting a timestamp?
so I've got a data table from a sensor that I am not quite sure how to get formatted correctly. It's a light sensor that outputs voltage readings.
The first column in the table is the wavelength measured and then there's 100+ columns for each time instance it measures data.
How would I go about transforming or pivoting this correctly? Would just a Table Transpose be the correct activity?
Next, advice on how to convert raw timestamp into a usable timeseries? It comes out looking like this.
DD-MM-YYYYTHH:MM:SS.###Z
what can I do to convert this into a usable timeseries value to plot as an x-axis? It's down to the thousandth of a second, 0.1s increments.
Bonus, how to do this to find the min and max and normalize the time to be 0-->max?
...
14-07-2020T22:47:31.400Z
14-07-2020T22:47:31.500Z
14-07-2020T22:47:31.600Z
14-07-2020T22:47:31.700Z
14-07-2020T22:47:31.800Z
14-07-2020T22:47:31.900Z
...
- Mark as New
- Bookmark
- Subscribe
- Mute
- Subscribe to RSS Feed
- Get Direct Link
- Report Inappropriate Content
Re: Help doing a table transform and converting a timestamp?
@aliegner1 wrote:
Question about the timestamps: how would I convert this to a raw time duration? I'm seeing there's the "Date Difference" formula, but it looks like it needs two columns. How do I just make this a time series starting at 0.000s --> max time?
Before we go too much further I think we need to clarify this question here. @txnelson interpreted that as you wanting to get rid of the date portion of the datetime value. I don't think that's what you want.
You've now got a column of datetime values. That column can be used as a time series, it just won't start at 0.
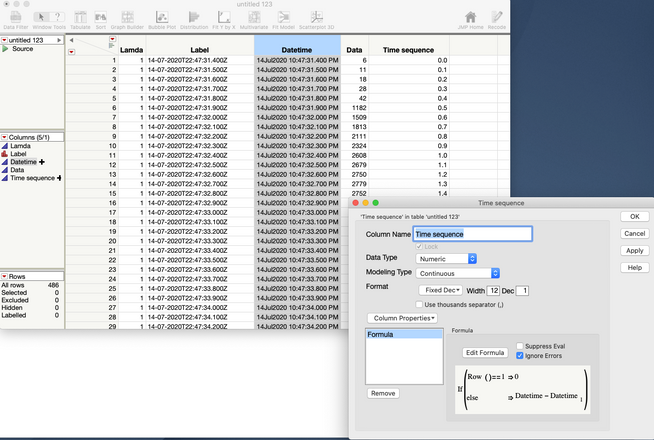
If, instead, you'd rather a column that counted the time difference between consecutive rows of the data table that's easy to do with simple subtraction and row subscripting.
I have a couple of things to point out here:
- In the first row the value is set to 0.
- I don't need to use the Date Difference() function because I'm interested in the values in secs. So, simple subtraction works.
- Because of floating point arithmetic the difference in these values aren't precisely on the tenths of a second. I've formatted this column to display in tenths of a second, i.e. Fixed Dec with 1 decimal place.
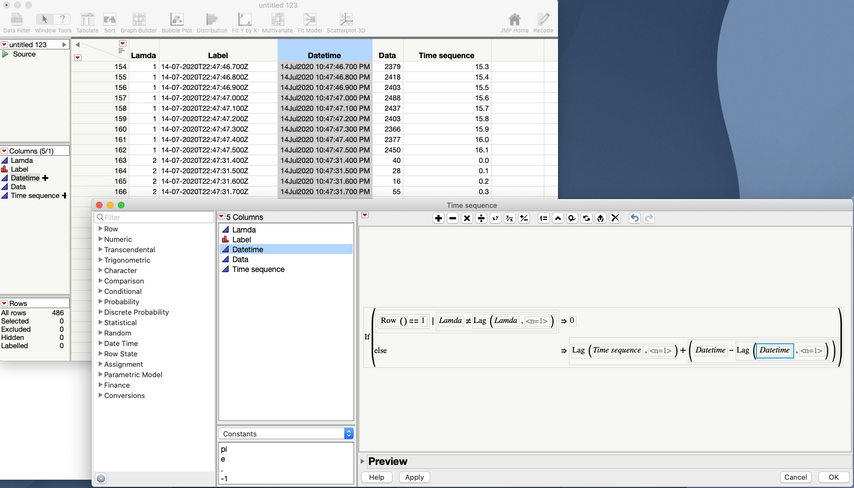
- Finally, but perhaps more complicated is that your original question said that you had multiple wavelengths. Do you want to restart this time sequence at 0 for each wavelength? If so, that's not a problem. It will just take a couple of changes to the formula.
- Now the formula checks for row 1 or for the lamda value to be different from the previous lambda (using the Lag() function) to set the sequence to 0.
- It also uses Lag() to get the value of the sequence in the previous row and adds the difference in the time values between the current and previous rows.
I hope this helps clarify and provide a good direction.
- Mark as New
- Bookmark
- Subscribe
- Mute
- Subscribe to RSS Feed
- Get Direct Link
- Report Inappropriate Content
Re: Help doing a table transform and converting a timestamp?
Thank you Jeff. Your input on that final equation is great and removes the worry about a run that crosses midnight.
- « Previous
-
- 1
- 2
- Next »
Recommended Articles
- © 2026 JMP Statistical Discovery LLC. All Rights Reserved.
- Terms of Use
- Privacy Statement
- Contact Us


