- Don’t miss your chance to experience Discovery Summit Europe at our best available rate! Early bird registration through 31 Oct.
- Graph Builder Toolbar streamlines interactive graphing. Creates shortcuts on Report and GraphBuilder Helpers toolbars. Download and install the extension.
- JMP will suspend normal business operations for our Rest and Recharge Day on Friday, October 2, 2026.
Regular business hours will resume on Monday, October 5, 2026.
- Subscribe to RSS Feed
- Mark Topic as New
- Mark Topic as Read
- Float this Topic for Current User
- Bookmark
- Subscribe
- Mute
- Printer Friendly Page
Discussions
Solve problems, and share tips and tricks with other JMP users.- User Community
- :
- Discussions
- :
- Re: GraphBuilder and Passing Bablok fit?

- Mark as New
- Bookmark
- Subscribe
- Mute
- Subscribe to RSS Feed
- Get Direct Link
- Report Inappropriate Content
GraphBuilder and Passing Bablok fit?
I have created a representation of my data using graph builder that I am happy with. I would like to include Passing Bablok fits, as this is the most appropriate method in this case. I know I can do this via bivariate fitting separately (and I have done so), but the graphical representation as well as the advanced fitting together is what I am after.
How can I achieve this?


- Mark as New
- Bookmark
- Subscribe
- Mute
- Subscribe to RSS Feed
- Get Direct Link
- Report Inappropriate Content
Re: GraphBuilder and Passing Bablok fit?
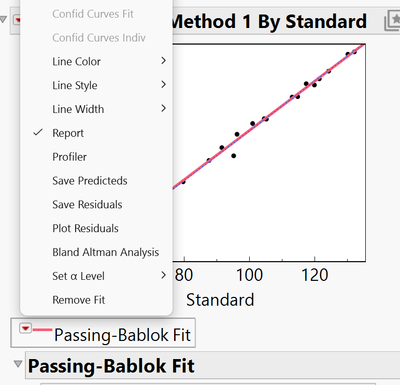
In order to plot a Passing Bablok fit (or any other fit from a modeling platform) in Graph Builder, first save the model equation as a column in the data table. From the Bivariate platform, use the Red Triangle to Save Predicted. To fit+export many series at once, hold down the Ctrl key while using the Red Triangle Menu.
Then, in Graph Builder, add the fit equations in the Y-axis role, the same way you added the data points. Use the Formula graph type for best results:


- Mark as New
- Bookmark
- Subscribe
- Mute
- Subscribe to RSS Feed
- Get Direct Link
- Report Inappropriate Content
Re: GraphBuilder and Passing Bablok fit?
There is a wish to add Deming and Passing Bablock to Graph Builder:
Graph Builder: robust regressions
It has already received several kudos — with some additional support, it might be included in a future version of JMP ...
Recommended Articles
- © 2026 JMP Statistical Discovery LLC. All Rights Reserved.
- Terms of Use
- Privacy Statement
- Contact Us