cancel
Showing results for 
Show  only  | Search instead for 
Did you mean: 
  • New to JMP? Join us Sept. 23-24 for the Early User Edition of Discovery Summit, tailor-made for new users. Register now for free!
  • Use World Cup data to build models, explore spatial relationships, and create informative visualizations in JMP. Register. July 17, 2 pm US Eastern Time.
  • Your voice matters! Tell us how you prefer to receive JMP updates, so we can tailor our communication to your needs. Take short survey.

Discussions

Solve problems, and share tips and tricks with other JMP users.
Choose Language Hide Translation Bar
PhamBao
Level III

Graph changes when switching to JMP14

Dear all users,
I just install JMP14 and experience a slight difference compared to JMP12

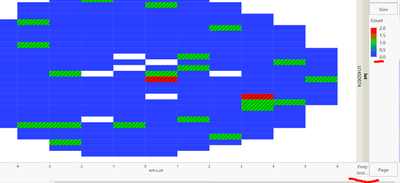
For example,  the image below is from JMP12
PhamBao_2-1636547385750.png


When I use JM14 and drag the parameter in Freg, all the cell with 0 is transparent . This means that the graph only illustrates number 1 and 2. 
Do you know how to make the graph to display number 0 as JMP 12 did.

Sincerely

1 REPLY 1
XanGregg
Staff

Re: Graph changes when switching to JMP14

I suspect Graph Builder was aligning with stat platforms where freq==0 values are ignored. You should be able to get the old view by putting the variable into the color role instead of the freq role,

Recommended Articles