- Don’t miss your chance to experience Discovery Summit Europe at our best available rate! Early bird registration through 31 Oct.
- Graph Builder Toolbar streamlines interactive graphing. Creates shortcuts on Report and GraphBuilder Helpers toolbars. Download and install the extension.
- JMP will suspend normal business operations for our Rest and Recharge Day on Friday, October 2, 2026.
Regular business hours will resume on Monday, October 5, 2026.
- Subscribe to RSS Feed
- Mark Topic as New
- Mark Topic as Read
- Float this Topic for Current User
- Bookmark
- Subscribe
- Mute
- Printer Friendly Page
Discussions
Solve problems, and share tips and tricks with other JMP users.- User Community
- :
- Discussions
- :
- Fitting multiple normal mixture to data

- Mark as New
- Bookmark
- Subscribe
- Mute
- Subscribe to RSS Feed
- Get Direct Link
- Report Inappropriate Content
Fitting multiple normal mixture to data
Hello,
I would like to get multiple normal mixture fitting to my data similar to what is presented here
arXiv:1306.5856
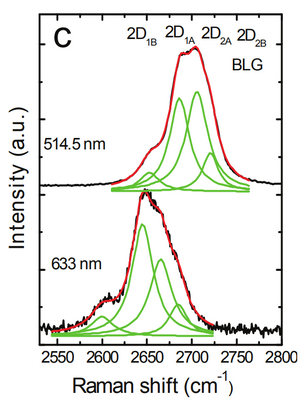
Any thought on how this can done in JMP or JSL? Can I set a lower/upper limit on each peak locations in exchange for, likely, worse fits?


- Mark as New
- Bookmark
- Subscribe
- Mute
- Subscribe to RSS Feed
- Get Direct Link
- Report Inappropriate Content
Re: Fitting multiple normal mixture to data
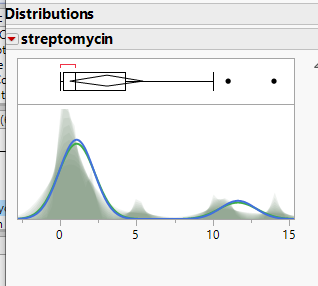
There is a similar capability in the Distribution Platform if you use a Shadowgram option and then you can place 2 and 3 mixture distributions on the Shadowgram

- Mark as New
- Bookmark
- Subscribe
- Mute
- Subscribe to RSS Feed
- Get Direct Link
- Report Inappropriate Content
Re: Fitting multiple normal mixture to data
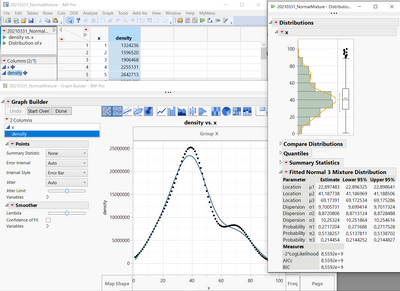
I think this can be done in the distribution platform -> fit normal 3 mixture, see screenshot.
Probably you have to transform your target column to integers, so that frequency role in distribution platform works, see example script below. The script will generate a table, and you can execute the graph builder and distribution platform.
If you need to fit more complex curves, you may have a look at reliability platform or for custom defined fitting nonlinear platform, the latter one is very powerful, but tricky to fit.
There are also other posts dealing with this issue:
BR
New Table( "20210331_NormalMixture",
	Add Rows( 100 ),
	New Script(
		"density vs. x",
		Graph Builder(
			Variables( X( :x ), Y( :density ) ),
			Elements( Points( X, Y, Legend( 6 ) ), Smoother( X, Y, Legend( 7 ) ) )
		)
	),
	New Script(
		"Distribution of x",
		Distribution(
			Freq( :density ),
			Continuous Distribution( Column( :x ), Fit Normal 3 Mixture ),
			SendToReport(
				Dispatch( {"x"}, "Compare Distributions", OutlineBox, {Close( 1 )} ),
				Dispatch( {"x"}, "Quantiles", OutlineBox, {Close( 1 )} ),
				Dispatch( {"x"}, "Summary Statistics", OutlineBox, {Close( 1 )} )
			)
		)
	),
	New Column( "x",
		Numeric,
		"Continuous",
		Format( "Best", 12 ),
		Formula( Row() ),
		Set Display Width( 53 )
	),
	New Column( "density",
		Numeric,
		"Continuous",
		Format( "Best", 12 ),
		Formula(
			Round(
				1000000000 * Normal Mixture Density(
					:x,
					[20, 40, 70],
					[10, 10, 10],
					[0.2, 0.6, 0.2]
				)
			)
		),
		Set Selected,
		Set Display Width( 91 )
	)
);Recommended Articles
- © 2026 JMP Statistical Discovery LLC. All Rights Reserved.
- Terms of Use
- Privacy Statement
- Contact Us