- Don’t miss your chance to experience Discovery Summit Europe at our best available rate! Early bird registration through 31 Oct.
- Graph Builder Toolbar streamlines interactive graphing. Creates shortcuts on Report and GraphBuilder Helpers toolbars. Download and install the extension.
- Subscribe to RSS Feed
- Mark Topic as New
- Mark Topic as Read
- Float this Topic for Current User
- Bookmark
- Subscribe
- Mute
- Printer Friendly Page
Discussions
Solve problems, and share tips and tricks with other JMP users.- User Community
- :
- Discussions
- :
- Fitting a line through 3D points

- Mark as New
- Bookmark
- Subscribe
- Mute
- Subscribe to RSS Feed
- Get Direct Link
- Report Inappropriate Content
Fitting a line through 3D points
Hey everyone,
I have a list of 3D points (x,y,z) that I need to fit a line to. I've tried fitting three different models, each one using the balance of the columns to predict a since output (so like Y(x,z)) but using the three outputs is not giving me a line. The best I can do is using Y(z) and X(z) and then using the values of z for the final predicted best fit (x,y,z). However, I'm not happy about not having a predicted Z value. I also tried using the row number Z(row#) as a way to predict a z value but this may only work in this instance as z is a movement along a part and thus the variation in it is tied to the variation in the inspection head movement between inspection points.
Using the three OLS models y(z), X(z), Z(row#)
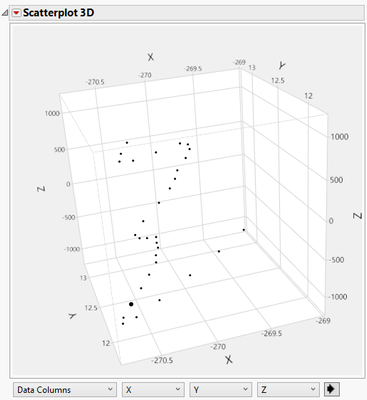
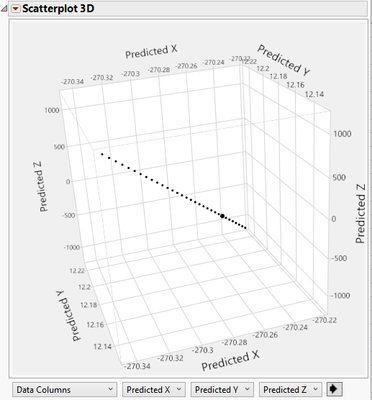
See attached for the data to play along with and thanks for any ideas!!
Accepted Solutions
- Mark as New
- Bookmark
- Subscribe
- Mute
- Subscribe to RSS Feed
- Get Direct Link
- Report Inappropriate Content
Re: Fitting a line through 3D points
Hey @SDF1, @txnelson, and @dlehman1
I think I got it!
The first step is to use Orthogonal regression to best fit a line with an assumption of equal variance. In JMP you can then output predicted values for both X and Y.
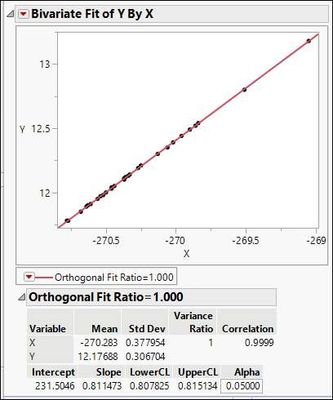
Now we need to rotate the line so that it is perpendicular to X or Y. I choose X. This requires rotating the line and data points by 39.06 degrees (as determined by the slope of the fitted line 0.811473)
Then we perform a fit Y by X where x is the rotated predicted X values and Y is the Z raw data values.
Then you save the formula predictions from this model and thus you have predicted x, y, and z values from a best fitted line in 3D.
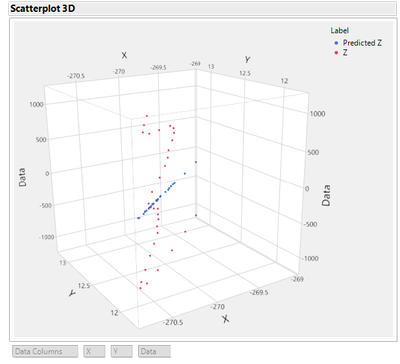
If you want all the values to not be on the diagonal then you can use the rotated pred Y and X with the Pred Z values.
I attached my data table with formulas in case this helps anyone follow along.
I also added the stacked data table per txnelson suggestion below for an overlay of the two data sources that works great and created the graph above.


- Mark as New
- Bookmark
- Subscribe
- Mute
- Subscribe to RSS Feed
- Get Direct Link
- Report Inappropriate Content
Re: Fitting a line through 3D points
Hey Steve,
I think Principal Components Analysis is a good approach here. The first principal component is, in a way, the best-fitting line through that 3D cloud of datapoints.
To translate that first principal component into the original XYZ coordinate system, select "Save Columns > Save Predicteds as Component Formulas" from the red triangle in the PCA report. Workflow attached.
-------------------
EDITED TO ADD:
Depending on what you are trying to accomplish, you may need to choose "Unscaled" rather than "Standardized" for the PCA. Attaching the unscaled version as well.

- Mark as New
- Bookmark
- Subscribe
- Mute
- Subscribe to RSS Feed
- Get Direct Link
- Report Inappropriate Content
Re: Fitting a line through 3D points
I'm having a hard time getting my head around the idea of fitting a line in 3 dimensions. There is a unique best fitting plane, but I only think there is a unique best fitting line specifying 2 dimensions out of the 3. You seem to have done those bivariate fits, but what is it you are looking for. Also, if your question is not really general but specific to data such as you posted, X and Y are almost perfectly correlated, so you really only have 2 dimensions. That is why your X vs Z and y vs Z fits are almost identical (although clearly not linear).
- Mark as New
- Bookmark
- Subscribe
- Mute
- Subscribe to RSS Feed
- Get Direct Link
- Report Inappropriate Content
Re: Fitting a line through 3D points
Thanks for thinking it over dlehman1, I am also feeling a little cross-eyed thinking about this as well. I am trying to help a colleague to mimic what an inspection program is doing so he can compare results. The program will fit a line through the 3D points and then give a distance measurement from the best fit and the measured point. I read some articles online but nothing really clicked for me (lots of math talk over my head!). One article suggested using PCA but when I tried this and had it predict the X, Y, and z values it did not give a line.
Yeah it is interesting that Y and X are so correlated.
I'll keep pondering, if there is anything else you need from me to clear up the ask please let me know.
Steve


- Mark as New
- Bookmark
- Subscribe
- Mute
- Subscribe to RSS Feed
- Get Direct Link
- Report Inappropriate Content
Re: Fitting a line through 3D points
Hi @shampton82 ,
I'm with @dlehman1 with this, as a line in 3D can always be decomposed into two independent variable like X & Y or Y & Z by a transformation of your coordination system, hence the unique plane that will contain that line. But your data seems to be something different. I still don't get the overall whole point of fitting the line in 3D. If you really have to, I guess I'd just change your coordinate system, as the plane containing the "3D" data is just along the X-Y diagonal.
In the case of the data you shared, it looks like you have profile measurements of something that are measured at regular intervals of 75 units (mm, um, nm?) in the z-direction. Looking at the x vs z and y vs z profiles, it really looks a lot like AFM data or something similar. And with X and Y being so strongly correlated, it's almost like it's just rastered a step of 231 units (in Y) -- the intercept in your fit Y by X graph -- and then the item is measured again.
One of the things that I don't really understand is what kind of information you are trying to get out of this program you use -- you mention that it fits a line through the 3D points and then gives a distance measurement from the best fit and the measured point? This is essentially looking at the residuals of the fit -- you're looking at how far away from your fit the data is. Are you trying to predict the residuals? Are you really trying to predict the Z value, or are you trying to predict the X and Y? The lines you fit in the data you shared are predicting X and Y, not Z.
There's a lot here I don't quite get, but I think it might be because you can't share everything. However the more you can share and keep anonymized, the closer we might get to helping you obtain the solution you're after.
Hope this helps!,
DS
- Mark as New
- Bookmark
- Subscribe
- Mute
- Subscribe to RSS Feed
- Get Direct Link
- Report Inappropriate Content
Re: Fitting a line through 3D points
Thanks @SDF1 !
I admit it is hard as I am trying to help a collogue that is remote at another plant so I don't have all the details, figuring it out as I dissect the data. I came across the same conclusion as you that the X and Y appear to be the inspection path of the measurement head and the Z appears to be the main component of the parts surface profile.
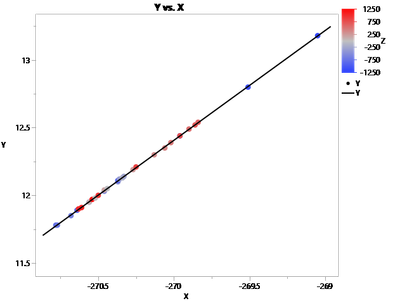
There is some weirdness in the distribution of the hit spacing (even have one it right on top of itself along with vastly different values for Z) as well as why a straight line can't be followed so I think they have some MSA issues to deal with as well.
I am not sure why they need the delta in 3D space, I'm going to try and get more details from them.
Since it was on the diagonal I also was going to try and rotate the plane and then use the Z(x) to find the final fit. Interestingly, I found that by using Orthogonal regression with Y and X and setting the variances as equal I can get a best fit line for Y and X that will output predicted Y's and X's. So I think rotating these Orthogonal Values (OV) then fitting the rotated X's OV vs the Z values will allow me to fit a line to the Z values and thus I would have predictors for x, y, and z.
I'll let you know how it goes or if I get any additional info. thanks for all the input!!
Steve
- Mark as New
- Bookmark
- Subscribe
- Mute
- Subscribe to RSS Feed
- Get Direct Link
- Report Inappropriate Content
Re: Fitting a line through 3D points
Hey @SDF1, @txnelson, and @dlehman1
I think I got it!
The first step is to use Orthogonal regression to best fit a line with an assumption of equal variance. In JMP you can then output predicted values for both X and Y.
Now we need to rotate the line so that it is perpendicular to X or Y. I choose X. This requires rotating the line and data points by 39.06 degrees (as determined by the slope of the fitted line 0.811473)
Then we perform a fit Y by X where x is the rotated predicted X values and Y is the Z raw data values.
Then you save the formula predictions from this model and thus you have predicted x, y, and z values from a best fitted line in 3D.
If you want all the values to not be on the diagonal then you can use the rotated pred Y and X with the Pred Z values.
I attached my data table with formulas in case this helps anyone follow along.
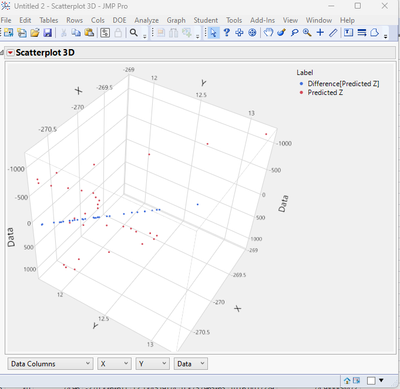
I also added the stacked data table per txnelson suggestion below for an overlay of the two data sources that works great and created the graph above.
- Mark as New
- Bookmark
- Subscribe
- Mute
- Subscribe to RSS Feed
- Get Direct Link
- Report Inappropriate Content
Re: Fitting a line through 3D points
Hi @shampton82 ,
Yes, you are correct in how to rotate your coordinate system by projecting the data in 3D onto a single plane -- X-Z or Y-Z, and then proceeding to fit the line. This will take into account the cos(theta) or sine(phi) projection onto whichever coordinate plane you need to.
Not being the subject master for your specific issue at hand, I still don't quite get the purpose of fitting a line to a highly non-linear data set and then calculating the residuals, however if that is what is needed, then this is the way to do it.
Glad to hear you're making progress to a solution for your colleague.
DS
- Mark as New
- Bookmark
- Subscribe
- Mute
- Subscribe to RSS Feed
- Get Direct Link
- Report Inappropriate Content
Re: Fitting a line through 3D points
Hey Steve,
I think Principal Components Analysis is a good approach here. The first principal component is, in a way, the best-fitting line through that 3D cloud of datapoints.
To translate that first principal component into the original XYZ coordinate system, select "Save Columns > Save Predicteds as Component Formulas" from the red triangle in the PCA report. Workflow attached.
-------------------
EDITED TO ADD:
Depending on what you are trying to accomplish, you may need to choose "Unscaled" rather than "Standardized" for the PCA. Attaching the unscaled version as well.
- Mark as New
- Bookmark
- Subscribe
- Mute
- Subscribe to RSS Feed
- Get Direct Link
- Report Inappropriate Content
Re: Fitting a line through 3D points
Thanks Jordan, this is great! When I started this project, some searches though the web mentioned this method and I gave it a try but I asked for 2 components to be saved which just tried to predict the points in 3D space so I moved on to try another method. Obviously didn't know what I was asking for having not used PCA much. Setting the output to 1 component per your instructions worked perfectly!
This method is a lot less steps!

- Mark as New
- Bookmark
- Subscribe
- Mute
- Subscribe to RSS Feed
- Get Direct Link
- Report Inappropriate Content
Re: Fitting a line through 3D points
I just stacked the 2 z variables you want to have plotted and then used the color capability of the platform to show the surface and the line
Recommended Articles
- © 2026 JMP Statistical Discovery LLC. All Rights Reserved.
- Terms of Use
- Privacy Statement
- Contact Us