- Instantly extract effect sizes, F-ratios, and FDR-adjusted p-values from your models with the Calculate Effects Sizes extension, available now in the JMP Marketplace!
- New to JMP? Join us Sept. 23-24 for the Early User Edition of Discovery Summit, tailor-made for new users. Register now for free!
- Your voice matters! Tell us how you prefer to receive JMP updates, so we can tailor our communication to your needs. Take short survey.
- Subscribe to RSS Feed
- Mark Topic as New
- Mark Topic as Read
- Float this Topic for Current User
- Bookmark
- Subscribe
- Mute
- Printer Friendly Page
Discussions
Solve problems, and share tips and tricks with other JMP users.- JMP User Community
- :
- Discussions
- :
- Re: Fitting Non-linear curve for selected data.

- Mark as New
- Bookmark
- Subscribe
- Mute
- Subscribe to RSS Feed
- Get Direct Link
- Report Inappropriate Content
Fitting Non-linear curve for selected data.
Instead of using the data columns directly from the data table, I wanted to you to use the columns that are selected by the user. But the values are not getting passed into the formula.
Y_axis = colListY << Get Items;
X_axis = colListX << Get Items;
Group_by = colListBy << Get Items;

New Column( "Model",
			Numeric,
			"Continuous",
		    Format( "Best", 12 ),
			Formula(
				Parameter(
									{p = 0.29, x0 = 15, m0 = 1.2, x1 = 30, m1 = 5},
									p * (1 - Exp( -(:X_axis / x0) ^ m0 )) + (1 - p) * (1
									-Exp( -(:X_axis / x1) ^ m1 ))
							)
						),

					);
					nlin = dt << Nonlinear(
						SendToByGroup( Bygroup Default ),
						Y( :Y_axis ),
						X( :Model ),
						Iteration Limit( 1000 ),
						Unthreaded( 1 ),
						QuasiNewton BFGS,
						Finish,
						By(:Group_By )
                    );
- Tags:
- windows

- Mark as New
- Bookmark
- Subscribe
- Mute
- Subscribe to RSS Feed
- Get Direct Link
- Report Inappropriate Content
Re: Fitting Non-linear curve for selected data.
You will have to have the data in data table to use different platforms. You can build user selection by using New Window().
- Mark as New
- Bookmark
- Subscribe
- Mute
- Subscribe to RSS Feed
- Get Direct Link
- Report Inappropriate Content
Re: Fitting Non-linear curve for selected data.
I created a new window and letting users to select the required fields, by using these column list boxes. But how to pass those values to non linear functions as it is taking columns from data table only.
Button box("X Column", colListX<<Append(colListData<<GetSelected)),
colListX = ColListBox(nLines(1)),
colListX << set min Items(1);
Button box("Y Column", colListY<<Append(colListData<<GetSelected) ),
colListY = Col List Box(nLines(1)),
colListY << set min Items(1);
Button box("BY Column", colListBy<<Append(colListData<<GetSelected)),
colListBy = Col List Box(nLines(1))
);


- Mark as New
- Bookmark
- Subscribe
- Mute
- Subscribe to RSS Feed
- Get Direct Link
- Report Inappropriate Content
Re: Fitting Non-linear curve for selected data.
Vinusha,
Since you do not have the complete script for your custom user dialog, I am guessing at the problem. I think it is how to get and use the input from a ColListBox. Below is a snippet from a script written for a JSL applications book. the results of a colListBox is a list of column names , text, not column references.
_init = {_yusr={}, _xusr={},  _gusr={}};
EvalList(_init);

//define expressions, actions
_src_get = Expr( _src << Get Selected );

//dialog
ccol_dlg = New Window("Custom Column Dialog", <<Modal,

  <<On Validate(
     If(nitems(_yusr)<2 | nitems(_xusr)<1, req_err; 0, 1);  //0 on err, 1 if ok
     ),    //end On Validate
  HListBox(
// ----- create the source collistbox-----------------------------------------------
  	Panel Box("Select Columns",
  	   _src=ColListBox(All)
  	),
  	VListBox(
  	Panel Box("Cast Selected Columns into Roles",
  	   LineUpBox( Ncol(2),
 //------ create button and collistbox container for each role ---------------------

 //------Y, Response----------------------------------------------------------------
  	     _ybb  = ButtonBox("Y, Response", _yclb << Append( _src_get ) ),
  	     _yclb = ColListBox(nlines(6), min items(2), numeric,
  	        On Change(_yusr = (_yclb << get items) )) ,

 //------X, Treatment----------------------------------------------------------------
  	     _xbb  = ButtonBox("X, treatment", _xclb << Append( _src_get ) ),
	     _xclb = ColListBox(nlines(2), min items(1), max items(1), character,
	        On Change(_xusr = (_xclb << get items) )),

//------Group Factors----------------------------------------------------------------
  	     _gbb = ButtonBox("Group Factors", _gclb << Append( _src_get ) ),
  	      _gclb = ColListBox(nlines(6), any,
  	        On Change( _gusr = (_gclb << get items) )),

//------Remove Button----------------------------------------------------------------
  	     ButtonBox("Remove",
  	        _yclb << Remove Selected;
  	     	_xclb << Remove Selected;
  	        _gclb << Remove Selected;
  	     ) //end Remove
  	  )  //end LineupBox
    ),  //end Panel Box "Cast Selected..."
    HListBox(spacer box(51), ButtonBox("OK"), ButtonBox("Cancel"))
    ) //end VListBox
  )  //end HListBox
);  //end New Window
show(_yusr, _xusr, _gusr);
Specify column sex for the X variable. Run this script and look at the output in the LOG window
show(_yusr, _xusr, _gusr);
/*:

_yusr = {"weight", "height"};
_xusr = {"sex"};
_gusr = {"age"};
Your script new column formula and NLN needs column references. I believe that is what Jarmo was telling you.
//:*/
show(Column(_gusr[1]))

/*:

Column(_gusr[1]) = Column("age");
_gusr[1] is the column name "age" and to reference the column use Column(_gusr[1]) which is Column("age) and equivalent to :age.
- Mark as New
- Bookmark
- Subscribe
- Mute
- Subscribe to RSS Feed
- Get Direct Link
- Report Inappropriate Content
Re: Fitting Non-linear curve for selected data.
I have not used JMP much in versions 16 and 17. The previous script was written for JMP 13. Since then JMP/JSL keeps the in user window variables in column format. So the script can be simpler. See the output for col_dlg.
bc_dt = Open( "$SAMPLE_DATA/Big Class.JMP" );

//Below is JSL to build the basic dialog using the Column Dialog function.

col_dlg = Column Dialog(
	_yVar = ColList( "Y, Response",, Data Type(Numeric), MinCol (1) ),
	_xVar = ColList( "X, Treatment", Data Type(Character), MinCol(1), MaxCol(1) ),
	_grpVar = ColList( "Group Factors", Data Type(Any) ),
);


Show( col_dlg, col_dlg["_yVar"], col_dlg["_xVar"],
  col_dlg["_grpVar"], col_dlg["Button"] );

If (col_dlg["Button"] == -1, Throw( "User Cancel") );
Remove From( col_dlg , N Items(col_dlg) ); //Remove the last item
Eval List ( col_dlg );

Show( col_dlg, _yVar, _xVar, _grpVar );
Here is the output
Show( col_dlg, _yVar, _xVar, _grpVar  );


/*:
col_dlg = {_yVar = {:height, :weight}, _xVar = {:sex}, _grpVar = {:age}, Button(1)};
col_dlg["_yVar"] = {:height, :weight};
col_dlg["_xVar"] = {:sex};
col_dlg["_grpVar"] = {:age};
col_dlg["Button"] = 1;
col_dlg = {_yVar = {:height, :weight}, _xVar = {:sex}, _grpVar = {:age}};
_yVar = {:height, :weight};
_xVar = {:sex};
_grpVar = {:age};
So you can reference a column as _yVar[1], etc.
- Mark as New
- Bookmark
- Subscribe
- Mute
- Subscribe to RSS Feed
- Get Direct Link
- Report Inappropriate Content
Re: Fitting Non-linear curve for selected data.
You can (usually) use Eval()
Names Default To Here(1);
dt = Open("$SAMPLE_DATA/Nonlinear Examples/US Population.jmp");

nw = New Window("User Selections", << Modal, << Return Result,
	H List Box(
		Panel Box("Column Selections",
			window:fcs = Filter Col Selector(dt)
		),
		Panel Box("User Selections",
			Lineup Box(N Col(2),
				Button Box("X", << Set Function(Function({this},
					(this << sib) << Set Items((window:fcs << Get Selected));
				))),
				clb_x = Col List Box(dt, Min Items(1), Max Items(1), N Lines(2)),
				Button Box("Y", << Set Function(Function({this},
					(this << sib) << Set Items((window:fcs << Get Selected));
				))),
				clb_y = Col List Box(dt, Min Items(1), Max Items(1), N Lines(2)),
				Button Box("By", << Set Function(Function({this},
					(this << sib) << Set Items((window:fcs << Get Selected));
				))),
				clb_by = Col List Box(dt, Max Items(1), N Lines(2)),
			)
		),
		Panel Box("Actions",
			Lineup Box(N Col(1),
				Button Box("OK",
					x_selection = clb_x << get items;
					y_selection = clb_x << get items;
					by_selection = clb_x << get items;
				),
				Button Box("Cancel"),
			)
		)
	)
);

obj = Nonlinear(
	Y(Eval(y_selection)),
	X(Eval(x_selection)),
	Finish()
);- Mark as New
- Bookmark
- Subscribe
- Mute
- Subscribe to RSS Feed
- Get Direct Link
- Report Inappropriate Content
Re: Fitting Non-linear curve for selected data.
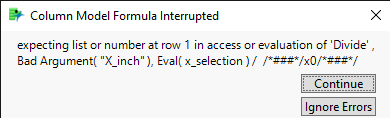
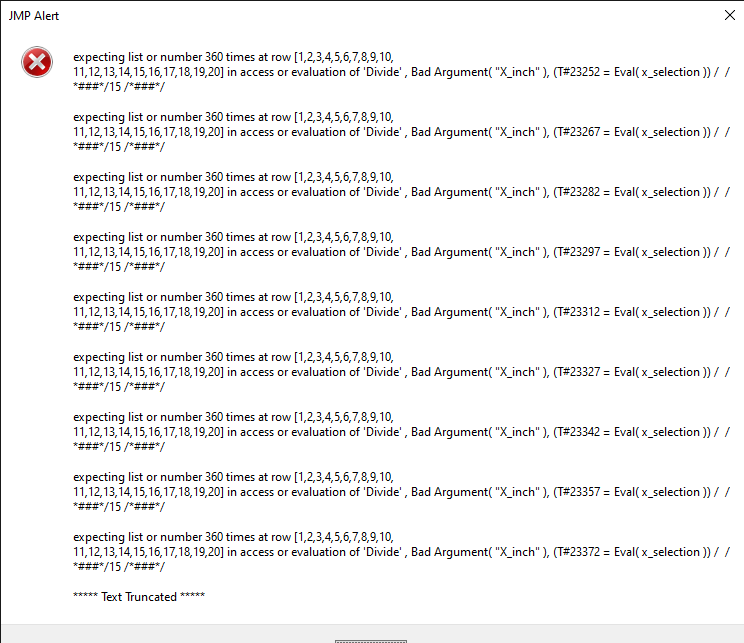
I executed the same thing but I am getting an error and also in the data table the column name is being displayed instead of the values.
Names Default To Here( 1 );
Error = expr(New Window("JMP ALERT" , <<Modal, alert=Textbox("Please select the required fields."), alert<< set font size(11), <<set font name("Calibri"), ButtonBox("OK")));
Openwindow = expr(Distribution << open window);
dt = Open( "C:\Users\vgarlap1\Documents\JMP Application\2016_37742-Dist.XLS_Length_n (2).jmp", invisible(1) );
Distribution = New Window( "Distribution Fit",
	<< modal(),
	<<On Close( Close( dt, nosave )),
	V List Box(
			Spacer Box(Size(2, 4)),
			Title = Text Box("AFIS Length Distribution Fit"),
			Title1 = Text Box("(Customized procedure for Ln)"),
			Title << set font size(12), << set width(240), <<set font name("Calibri") ;
			Title1 << set font size(11), << set width(240);
			Spacer Box(Size(4, 6)),
			H List Box(
				Panel Box( "Column List",
					ColListData = Col List Box(
						all,
						width( 250 ),
						maxSelected( 1 )
					)
				),
			V list box(
				Panel Box( "Column Selection",
					Lineup Box( N Col( 2 ),
						Button box("X Column", << Set Function(Function({this},(this << sib) << Set Items((ColListData << Get Selected));))),
						colListX = ColListBox(dt, Min Items(1), Max Items(1), N Lines(2)),
						Button box("Y Column",  << Set Function(Function({this},(this << sib) << Set Items((ColListData << Get Selected));))),
						colListY = ColListBox(dt, Min Items(1), Max Items(1), N Lines(2)),
						Button box("BY Column",  << Set Function(Function({this},(this << sib) << Set Items((ColListData << Get Selected));))),
						colListBy = ColListBox(dt, Min Items(1), Max Items(1), N Lines(2))
					);
				),
				H List box(
					Button box("Ok",
						//<<On Close(nosave),
						If(nitems(colListX << Get Items())<1 | nitems(colListY << Get Items())<1 ,
							Error,
						);


						dt= currentdatatable();

						icol = dt << Get Column Names();

						Nrows = N Row (dt);

						x_selection = colListX << get items;
						y_selection = colListY << get items;
						by_selection = colListBy << get items;

						New Column( "Model",
							Numeric,
							"Continuous",
							Format( "Best", 12 ),
							Formula(
							Parameter(
								{p = 0.29, x0 = 15, m0 = 1.2, x1 = 30, m1 = 5},
								p * (1 - Exp( -(Eval(x_selection)/ x0) ^ m0 )) + (1 - p) * (1
								-Exp( -Eval(x_selection)/ x1) ^ m1 )
								)
							),

						);


						nlin = dt << Nonlinear(
						SendToByGroup( Bygroup Default ),
						Y(Eval(y_selection)),
						X( :Model ),
						Iteration Limit( 1000 ),
						Unthreaded( 1 ),
						QuasiNewton BFGS,
						//Newton,
						Finish,
						By(Eval(by_selection)),

						);


					rnlin1 = Report( nlin[1] );

						//colListX << Clear Selection,
						//colListY << Clear Selection,
						//colListBy << Clear Selection

					),
					ButtonBox("Cancel", Distribution<<CloseWindow),
					ButtonBox("Remove",
                        colListX<<RemoveSelected;
                        colListY<<RemoveSelected;
                        colListBy<<RemoveSelected;
                    )
				)
			)
		)
	)
);
%20-%20JMP%20Pro%209_27_2023%202_33_23%20PM.png)
- Mark as New
- Bookmark
- Subscribe
- Mute
- Subscribe to RSS Feed
- Get Direct Link
- Report Inappropriate Content
Re: Fitting Non-linear curve for selected data.
For formulas you might have to evaluate the selected column there. This post gives ideas for that Insert one expression into another using Eval Insert, Eval Expr, Parse, and Substitute
- Mark as New
- Bookmark
- Subscribe
- Mute
- Subscribe to RSS Feed
- Get Direct Link
- Report Inappropriate Content
Re: Fitting Non-linear curve for selected data.
Why is it imp to use Exp and Eval in this case and could you me to use them with this equation as we are taking inputs from users.
x_selection = colListX << get items;
						y_selection = colListY << get items;
						by_selection = colListBy << get items;

						New Column( "Model",
							Numeric,
							"Continuous",
							Format( "Best", 12 ),
							Formula(
							Parameter(
								{p = 0.29, x0 = 15, m0 = 1.2, x1 = 30, m1 = 5},
								p * (1 - Exp( -(Eval(x_selection)/ x0) ^ m0 )) + (1 - p) * (1
								-Exp( -Eval(x_selection)/ x1) ^ m1 )
								)
							),

);Recommended Articles
- © 2026 JMP Statistical Discovery LLC. All Rights Reserved.
- Terms of Use
- Privacy Statement
- Contact Us