cancel
Showing results for 
Show  only  | Search instead for 
Did you mean: 
Choose Language Hide Translation Bar
29755
Level II

Fit Group Alternative

Hi all, 

I am trying to plot a bivariate table with polynomial fit degree and used FIT GROUP. But the line color doesn't change with accordance to the group by column when it is being run but when it is individually run, the line color changes according to the group by column. I think it is being affected by the fit group, is there any alternative ways to arrange plots into groups from different data table in the same format in fit group? 


Please help

data table("Stacked12") << Bivariate( Y(:HOURS STUDY), X(: TEST SCORE), 
GroupBy( :NAME( "SEX" ) ), Fit Polynomial(2), SendToReport( Dispatch( {}, "Bivar Plot", FrameBox, {Row Legend( SEX, Color( 1 ), Color Theme( "JMP Default" ), Marker( 0 ), Marker Theme( "" ), Continuous Scale( 0 ), Reverse Scale( 0 ), Excluded Rows( 0 ))}) ))


1 REPLY 1
txnelson
Super User

Re: Bivariate Group by Line Color

Using your code, just changing the column references to continuous columns in the Big Class data table, I tested the script back to JMP 11, and could not replicate your findings.  What version of JMP are you using, and what operating system

My version of your script

Names Default To Here( 1 );

// Open Data Table: big class.jmp
// → Data Table( "big class" )
Open( "$SAMPLE_DATA/big class.jmp" );

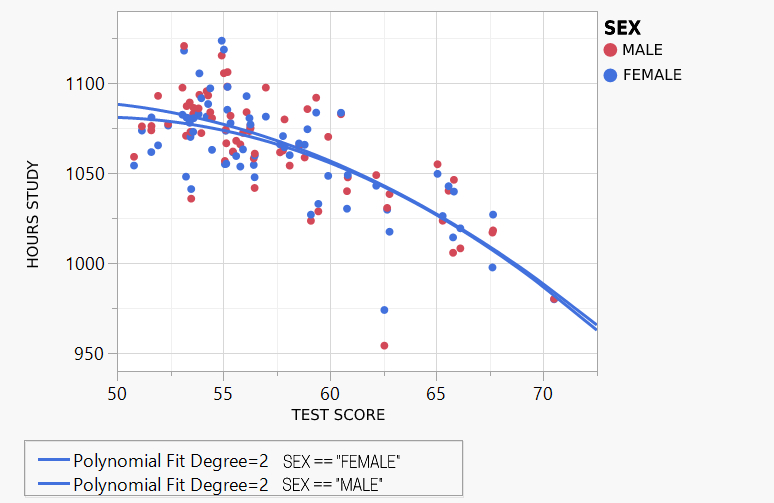
Data Table( "big class" ) << Bivariate(
	Y( :height ),
	X( :weight ),
	GroupBy( :NAME( "SEX" ) ),
	Fit Polynomial( 2 ),
	SendToReport(
		Dispatch(
			{},
			"Bivar Plot",
			FrameBox,
			{Row Legend(
				SEX,
				Color( 1 ),
				Color Theme( "JMP Default" ),
				Marker( 0 ),
				Marker Theme( "" ),
				Continuous Scale( 0 ),
				Reverse Scale( 0 ),
				Excluded Rows( 0 )
			)}
		)
	)
);
Jim