- Subscribe to RSS Feed
- Mark Topic as New
- Mark Topic as Read
- Float this Topic for Current User
- Bookmark
- Subscribe
- Mute
- Printer Friendly Page
Discussions
Solve problems, and share tips and tricks with other JMP users.- JMP User Community
- :
- Discussions
- :
- Re: Filter out data outside control limit specs
- Mark as New
- Bookmark
- Subscribe
- Mute
- Subscribe to RSS Feed
- Get Direct Link
- Report Inappropriate Content
Filter out data outside control limit specs
Hi,
I want to make a I-MR control chart. The data has many 'out of control points' which are outside +/-3 sigma control limits. I want to filter out all these out of control points and make a new charts with all points within control limits. How it can be done in JMP?
Accepted Solutions
- Mark as New
- Bookmark
- Subscribe
- Mute
- Subscribe to RSS Feed
- Get Direct Link
- Report Inappropriate Content
Re: Filter out data outside control limit specs
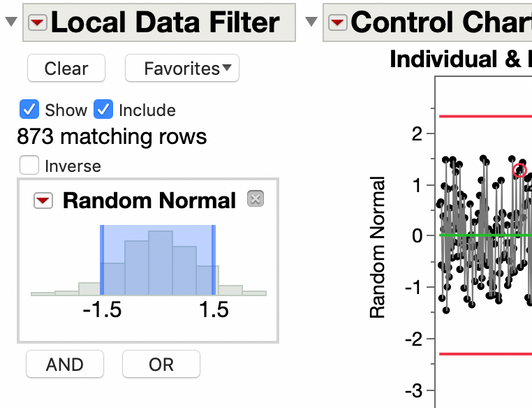
The quick and easy way is to use the local data filter.
Click on the red triangle menu on the control chart outline bar to find the option.
In this case, I just clicked on the numbers in the filter graph legend and edited them to -1.5 and 1.5.
- Mark as New
- Bookmark
- Subscribe
- Mute
- Subscribe to RSS Feed
- Get Direct Link
- Report Inappropriate Content
Re: Filter out data outside control limit specs
See @Byron_JMP answer above
Assuming you are using Chart Builder, this task is an easy one to do.
1. Bring up the chart in chart builder
2. Go to the red triangle in Chart Builder, and select "Save Limits".
3. While keeping the Chart Builder window open, Click on the original data table to make it the active window.
4. Go to the pull down menu Rows and select
Rows=>Row Selection=>Select Where
5. The Row Selection dialog box will appear
6. Select the column your chart is based on
7. In the comparisons selection down arrow, select "is greater than"
8. In the input box, enter the Upper Control Limit from the Graph Builder output and then click on the "Add Condition" button
9. In the comparisons selection down arrow, select "is less than"
10. In the input box, enter the Lower Control Limit from the Graph Builder output and then click on the "Add Condition" button
11. Now go to the Select row down arrow box and select "if any condition is met"
12. Click on OK
In your data table, all rows that are outside of your control limits have now been selected
13. Go to one of the rows that is selected and hover over the RowState Column(the column with the row numbers)
14. Right click on the selected row, and select "Hide and Exclude"
Now if you go back to your Graph Builder window, the display has been changed to only have the rows where they are inside the control limits.
Recommended Articles
- © 2026 JMP Statistical Discovery LLC. All Rights Reserved.
- Terms of Use
- Privacy Statement
- Contact Us


