Hi,
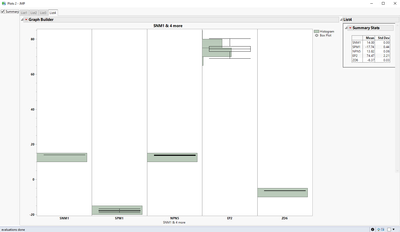
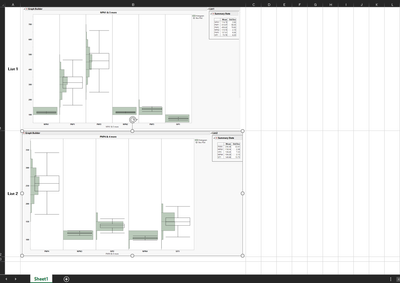
Is there a way to export the graphs in each tab box in the Excel cells that look something like the one below?
JMP Tab Box
Excel
Below is the jsl code to create graphs
dt = Open( "$SAMPLE_DATA/Semiconductor Capability.jmp" );

List1 = {"NPN1", "PNP1", "PNP2", "NPN2", "PNP3", "IVP1"};
List2 = {"PNP4", "NPN3", "IVP2", "NPN4", "SIT1"};
List3 = {"INM1", "INM2", "VPM1", "VPM2", "VPM3"};
List4 = {"SNM1", "SPM1", "NPN5", "EP2", "ZD6"};

var expr1 = Expr( Variables() );
For( c = 1, c <= N Items( List1 ), c++,
	x expr1 = Expr(
		X( Position( 1 ), Combine( "Parallel Merged" ) )
	);
	Insert Into( x expr1, List1[c], 1 );
	Insert Into( var expr1, Name Expr( x expr1 ) );
);

var expr2 = Expr( Variables() );
For( c = 1, c <= N Items( List2 ), c++,
	x expr2 = Expr(
		X( Position( 1 ), Combine( "Parallel Merged" ) )
	);
	Insert Into( x expr2, List2[c], 1 );
	Insert Into( var expr2, Name Expr( x expr2 ) );
);

var expr3 = Expr( Variables() );
For( c = 1, c <= N Items( List3 ), c++,
	x expr3 = Expr(
		X( Position( 1 ), Combine( "Parallel Merged" ) )
	);
	Insert Into( x expr3, List3[c], 1 );
	Insert Into( var expr3, Name Expr( x expr3 ) );
);

var expr4 = Expr( Variables() );
For( c = 1, c <= N Items( List4 ), c++,
	x expr4 = Expr(
		X( Position( 1 ), Combine( "Parallel Merged" ) )
	);
	Insert Into( x expr4, List4[c], 1 );
	Insert Into( var expr4, Name Expr( x expr4 ) );
);


lists = {"List1", "List2", "List3", "List4"};
var = {};
gbv = {};

For( i = 1, i <= 4, i++,
	Insert Into( var, Name Expr( Eval( Parse( "var expr" || Char( i ) ) ) ) );
	Insert Into( gbv, Parse( "vvv" || Char( i ) ) );
);

nw = New Window( "Plots",
	Show Menu( 0 ),
	show toolbars( 0 ),
	H List Box(

		Check Box(
			{"Summary"},

			<<Set Function(
				Function( {self},

					sel = self << get selected();
					If( N Items( sel ) > 0,
						For( i = 1, i <= N Items( lists ), i++,
							If( N Items( Eval( Parse( lists[i] ) ) ) > 0,
								nw[lists[i], Outline Box( 1 )] << append(


									V Scroll Box(
										size( 580 ),
										Border Box( Left( 5 ), Right( 5 ), Top( 5 ), Bottom( 5 ), Sides( 15 ),
											Tabulate(
												Show Control Panel( 0 ),
												Set Format( Uniform Format( 10, 2 ) ),
												Add Table(
													Column Table( Statistics( Mean, Std Dev ) ),
													Row Table(
														Analysis Columns(
															Eval( Parse( lists[i] ) )

														)
													)
												),


												SendToReport(
													Dispatch( {}, "Tabulate", OutlineBox, {Set Title( "Summary Stats" )} )


												)
											)
										)
									)


								) << Visibility( "Visible" );

							)
						);

					,
					/// Xpath syntax

	nw << XPath( "//Outlinebox[@helpKey = 'Summary Stats']" ) << delete;


					);
				);

			)


		),
		V List Box( tb = Tab Box() )
	)
);

For( i = 1, i <= N Items( lists ), i++,
	tb << Add(
		lists[i],
		V List Box(
			H List Box(
				Eval(
					Eval Expr(
						gb = dt << Graph Builder(
							Size( 1117, 781 ),
							Show Control Panel( 0 ),

							Expr( Name Expr( var[i] ) ),
							Elements(
								Histogram(
									X( 1 ),
									X( 2 ),
									X( 3 ),
									X( 4 ),
									X( 5 ),
									X( 6 ),
									X( 7 ),
									X( 8 ),
									X( 9 ),
									X( 10 ),
									X( 11 ),
									X( 12 ),
									X( 13 ),
									X( 14 ),
									X( 15 ),
									X( 16 ),

									Legend( 2 ),

								),
								Box Plot(
									X( 1 ),
									X( 2 ),
									X( 3 ),
									X( 4 ),
									X( 5 ),
									X( 6 ),
									X( 7 ),
									X( 8 ),
									X( 9 ),
									X( 10 ),
									X( 11 ),
									X( 12 ),
									X( 13 ),
									X( 14 ),
									X( 15 ),
									X( 16 ),

									Legend( 3 ),
									Outliers( 0 )
								)
							)
						)
					)
				),
				sumsta = Outline Box(

					lists[i],
					<<visibility( "Collapse" )


				)


			)
		)
	);


);