Turn on suggestions
Auto-suggest helps you quickly narrow down your search results by suggesting possible matches as you type.
- Don’t miss your chance to experience Discovery Summit Europe at our best available rate! Early bird registration through 31 Oct.
- Graph Builder Toolbar streamlines interactive graphing. Creates shortcuts on Report and GraphBuilder Helpers toolbars. Download and install the extension.
Options
- Subscribe to RSS Feed
- Mark Topic as New
- Mark Topic as Read
- Float this Topic for Current User
- Bookmark
- Subscribe
- Mute
- Printer Friendly Page
Discussions
Solve problems, and share tips and tricks with other JMP users.- User Community
- :
- Discussions
- :
- Re: Error Bars on a Stacked Bar Chart

Level I
- Mark as New
- Bookmark
- Subscribe
- Mute
- Subscribe to RSS Feed
- Get Direct Link
- Report Inappropriate Content
Error Bars on a Stacked Bar Chart
Created:
Aug 7, 2018 06:49 PM
| Last Modified: Aug 7, 2018 3:50 PM
(5728 views)
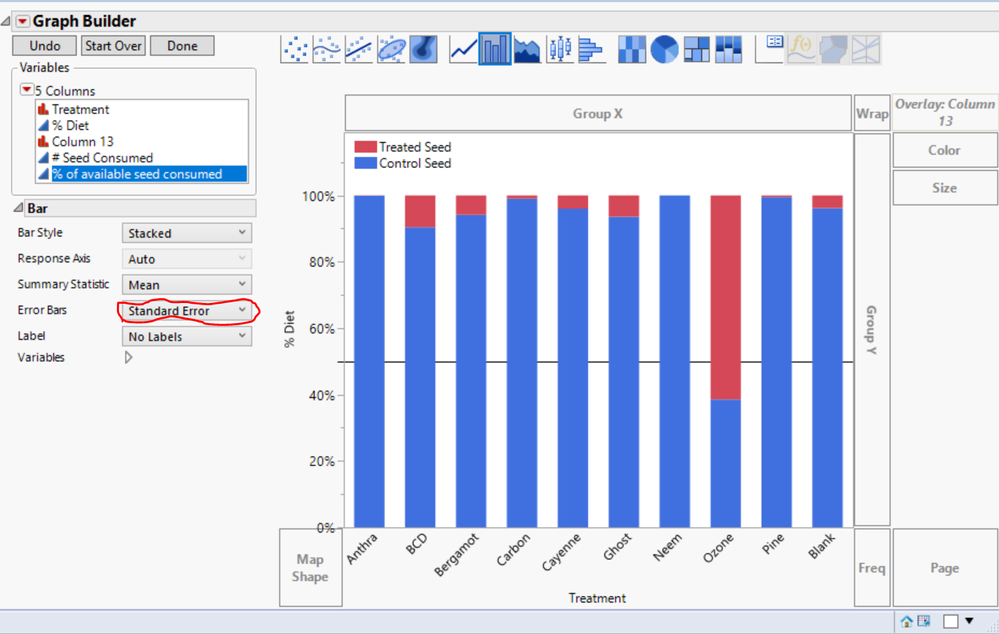
I am trying to make a stacked bar chart using graph builder in JMP 13 Pro. The output looks great except that it won't display the error bars. Seems to be working fine if I make a side by side clustered bar chart, but I don't think stacked bar charts support the error bars. Does anyone have a clever way of getting the standard error bars to appear? Thanks.
2 REPLIES 2


 Community Manager
- Mark as New
- Bookmark
- Subscribe
- Mute
- Subscribe to RSS Feed
- Get Direct Link
- Report Inappropriate Content
Re: Error Bars on a Stacked Bar Chart
I think the error bars are not displayed because it's not clear what it means to have an error bar on a stacked bar chart. The stacks here are the sum of the means of each group. What would the error bar on that bar chart be?
-Jeff
Level I
- Mark as New
- Bookmark
- Subscribe
- Mute
- Subscribe to RSS Feed
- Get Direct Link
- Report Inappropriate Content
Re: Error Bars on a Stacked Bar Chart
What I am aiming for are error bars on the blue bars. They would represent one standard error for the average mean of each treatment. The red bars are just there for visual clarity. I can make a chart of just the blue bars with error bars. Adding the red bars makes me lose this feature
Recommended Articles
- © 2026 JMP Statistical Discovery LLC. All Rights Reserved.
- Terms of Use
- Privacy Statement
- Contact Us