- Don’t miss your chance to experience Discovery Summit Europe at our best available rate! Early bird registration through 31 Oct.
- Graph Builder Toolbar streamlines interactive graphing. Creates shortcuts on Report and GraphBuilder Helpers toolbars. Download and install the extension.
- Subscribe to RSS Feed
- Mark Topic as New
- Mark Topic as Read
- Float this Topic for Current User
- Bookmark
- Subscribe
- Mute
- Printer Friendly Page
Discussions
Solve problems, and share tips and tricks with other JMP users.- User Community
- :
- Discussions
- :
- Re: Editing Color Gradient Scale Using JSL

- Mark as New
- Bookmark
- Subscribe
- Mute
- Subscribe to RSS Feed
- Get Direct Link
- Report Inappropriate Content
Editing Color Gradient Scale Using JSL
Hi All,
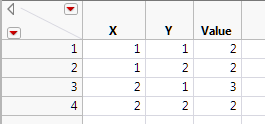
I have this data table for example
test = Graph Builder(
	Variables( X( :X ), Y( :Y ), Color( :Value ) ),
	Elements( Points( X, Y, Legend( 23 ) ) ),
	SendToReport(
		Dispatch(
			{},
			"400",
			ScaleBox,
			{Legend Model(
				23,
				Properties(
					0,
					{gradient(
						{Scale Values( [-2 2] ), Label Format( "Fixed Dec", 15, 3 )}
					)},
					Item ID( "Value", 1 )
				)
			)}
		)
	)
);
I run the above script to get this graph below with the color gradient +/-2 standard deviations. This helps to not show fliers if the data set is large.
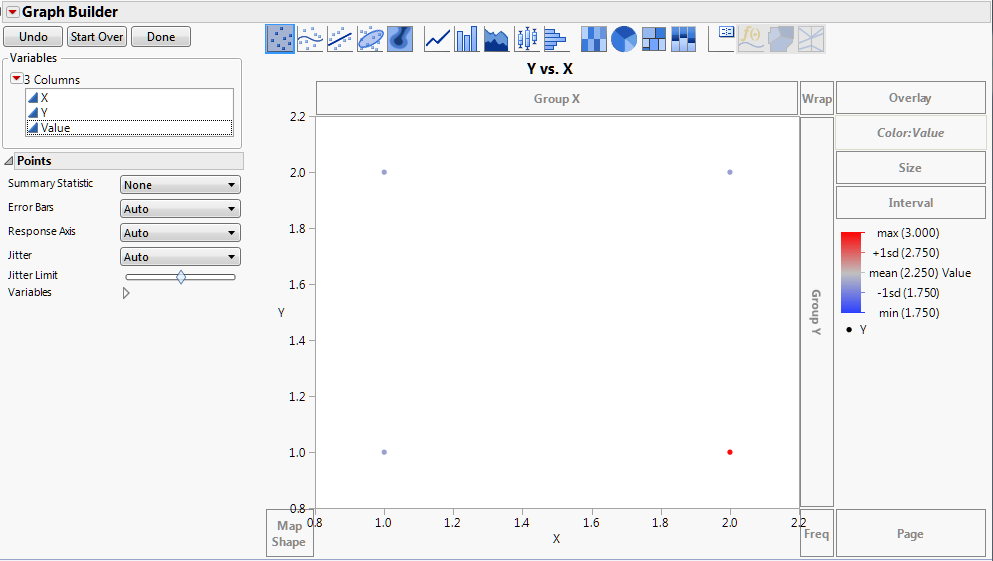
In the graph below the only thing I do is right click on the color gradient and change the scale type to linear (because it's easier to think in linear scales). I'm struggling to script this step.
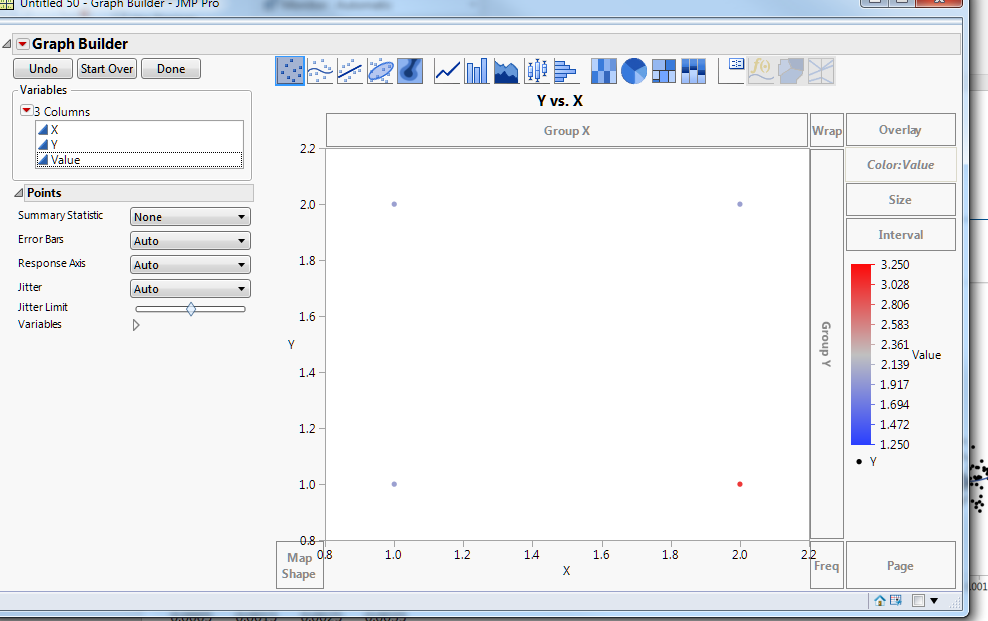
Note, I do not want the graph below which is just the default when making the graph before adjusting the gradient.
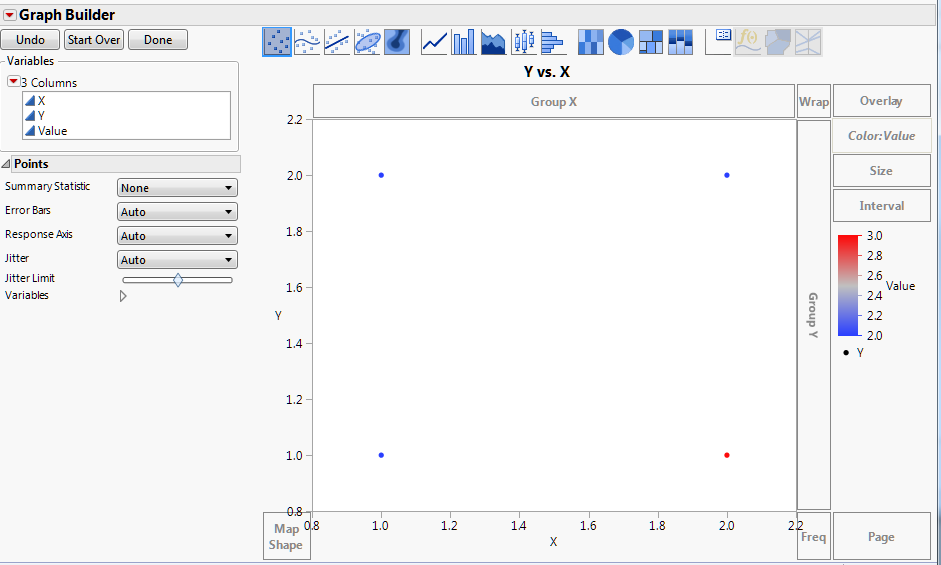
The closest I've gotten is below but it sets the scaled linearly from -2 to 2 which was what I inputted for the standard deviation limits.
test << Dispatch(
			{},
			"400",
			ScaleBox,
			{Legend Model(
				3,
				Properties(
					0,
					{gradient(
						{ Scale Values[ ], Label Format( "Fixed Dec", 15, 4 ),
						Scale Type( "Linear" )}
					)},
					Item ID( "Entry X Offset", 1 )
				)
			)}
		)
Any thoughts are much appreciated! - Evan


- Mark as New
- Bookmark
- Subscribe
- Mute
- Subscribe to RSS Feed
- Get Direct Link
- Report Inappropriate Content
Re: Editing Color Gradient Scale Using JSL
Work on the graph in GB and set the scale to exactly what you want. Then click the red triangle and select Script > Save to script window. Here's what I got after changing the scale somewhat:
Graph Builder(
	Show Control Panel( 0 ),
	Variables( X( :X ), Y( :Y ), Color( :Value ) ),
	Elements( Points( X, Y, Legend( 9 ) ) ),
	SendToReport(
		Dispatch( {}, "400", ScaleBox,
			{Legend Model( 9,
				Properties( 0,
					{gradient( {Scale Values( [2.2 2.6 3.2] )} )},
					Item ID( "Value", 1 )
				)
			)}
		)
	)
);
- Mark as New
- Bookmark
- Subscribe
- Mute
- Subscribe to RSS Feed
- Get Direct Link
- Report Inappropriate Content
Re: Editing Color Gradient Scale Using JSL
I don't want to have to do any manual work in Graph Builder though. The idea of my (larger) script is to automatically make many graphs with appropriate scaling for each graph and data set. To see patterns the scale needs to individually adjust for each column/set of data. There's too many to do manually.
- Mark as New
- Bookmark
- Subscribe
- Mute
- Subscribe to RSS Feed
- Get Direct Link
- Report Inappropriate Content
Re: Editing Color Gradient Scale Using JSL
The point of the exercise is to see what JSL GB produces for a customized scale. Once you have that you can programmatically determine the scaling for each dataset and substitute that into your GB JSL at runtime.
- Mark as New
- Bookmark
- Subscribe
- Mute
- Subscribe to RSS Feed
- Get Direct Link
- Report Inappropriate Content
Re: Editing Color Gradient Scale Using JSL
Here's an example where I'm dynamically determining the gradient from one of the columns.
dt = New Table( "Untitled", Add Rows( 4 ),
	New Column( "X", Numeric, "Continuous", Format( "Best", 12 ),
		Set Values( [1, 2, 3, 4] )  ),
	New Column( "Y", Numeric, "Continuous", Format( "Best", 12 ),
		Set Values( [4, 1, 3, 2] ) ),
	New Column( "Value", Numeric, "Continuous", Format( "Best", 12 ),
		Set Values( [1, 1, 2, 2] ) )
);

dtcol = column(dt, "Y");
one_min = col min(dtcol);
one_max = col max(dtcol);
one_avg = col mean(dtcol);

scale_matrix = matrix({one_min, one_avg, one_max});

Graph Builder(
	Show Control Panel( 0 ),
	Variables( X( :X ), Y( :Y ), Color( :Value ) ),
	Elements( Points( X, Y, Legend( 9 ) ) ),
	SendToReport(
		Dispatch( {}, "400", ScaleBox,
			{Legend Model( 9,
				Properties( 0,
					{gradient( {Scale Values( scale_matrix )} )},
					Item ID( "Value", 1 )
				)
			)}
		)
	)
);Recommended Articles
- © 2026 JMP Statistical Discovery LLC. All Rights Reserved.
- Terms of Use
- Privacy Statement
- Contact Us