Turn on suggestions
Auto-suggest helps you quickly narrow down your search results by suggesting possible matches as you type.
- Don’t miss your chance to experience Discovery Summit Europe at our best available rate! Early bird registration through 31 Oct.
- Graph Builder Toolbar streamlines interactive graphing. Creates shortcuts on Report and GraphBuilder Helpers toolbars. Download and install the extension.
- JMP will suspend normal business operations for our Rest and Recharge Day on Friday, October 2, 2026.
Regular business hours will resume on Monday, October 5, 2026.
Options
- Subscribe to RSS Feed
- Mark Topic as New
- Mark Topic as Read
- Float this Topic for Current User
- Bookmark
- Subscribe
- Mute
- Printer Friendly Page
Discussions
Solve problems, and share tips and tricks with other JMP users.- User Community
- :
- Discussions
- :
- Dot marker colour not showing up in loop for variability chart.

Level I
- Mark as New
- Bookmark
- Subscribe
- Mute
- Subscribe to RSS Feed
- Get Direct Link
- Report Inappropriate Content
Dot marker colour not showing up in loop for variability chart.
Created:
Mar 24, 2023 04:07 AM
| Last Modified: Jun 11, 2023 4:30 AM
(2490 views)
Hi,
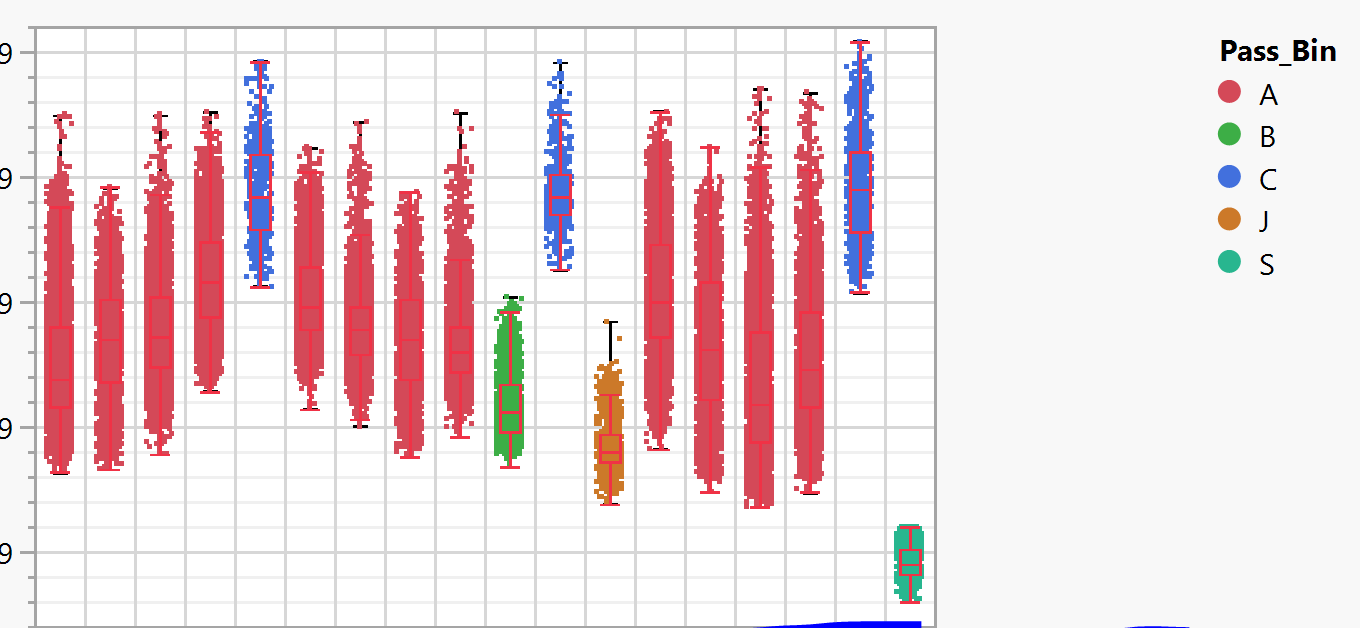
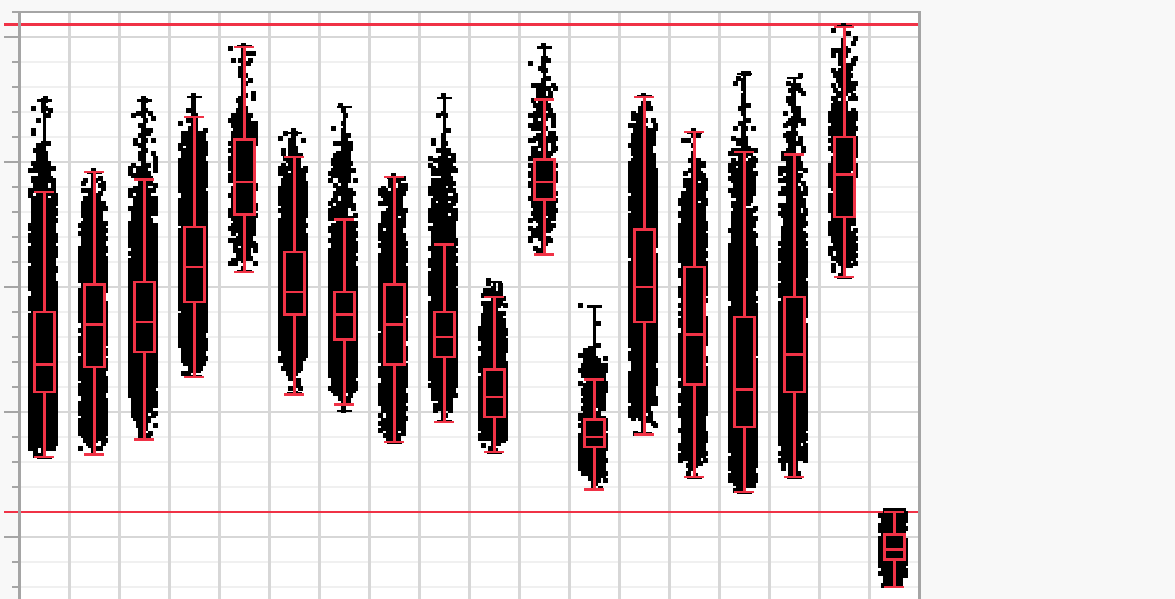
I wish to plot the box plot with marker colour according to one of the variable. It is working fine in single plot. However, when plotting the graph in a loop. the colour is not showing up. Would like to ask for help.
dt = Open("C:\test24_data\JSL\data.csv", Invisible);

dt_parameter = Open("C:\test24_data\JSL\parameter.csv", Invisible);

spec_dt = Open("C:\test24_data\JSL\spec_df.csv", Invisible);

nw = New Window( "graphs", myVLB = V List Box() );

//get_column into list
_dt0 = dt_parameter << Summary(
	Group( :Parameters),
	Freq( "None" ),
	Weight( "None" )
, Invisible);
dt_param_lst = column("Parameters") << GetAsMatrix();

Print(dt_param_lst);

_dt1 = dt << Summary(
	Group( :SpecName ),
	Freq( "None" ),
	Weight( "None" )
, Invisible);

spec_lst = column("SpecName") << GetAsMatrix();

Print(spec_lst);

_dt2 = spec_dt << Summary(
	Group( :parametername ),
	Freq( "None" ),
	Weight( "None" )
, Invisible);

spec_param_lst = column("parametername") << GetAsMatrix();

Print(spec_param_lst);

for (i = 1, i <= NItems(dt_param_lst), i++,

	//par = cols_to_plot[i];

	graph = dt << Variability Chart(
		Y( Column(dt_param_lst[i]) ),
		X( :Purpose,  :Reel ),
		Color( :Pass_Bin ),
		Std Dev Chart( 0 ),
		Points Jittered( 1 ),
		Show Box Plots( 1 ),
		SendToReport(
			Dispatch(
				{"Variability Chart for " || dt_param_lst[i]},
				"Variability Chart",
				FrameBox,
				{Row Legend(
					Pass_Bin,
					Color( 1 ),
					Color Theme( "JMP Default" ),
					Marker( 0 ),
					Marker Theme( "" ),
					Continuous Scale( 0 ),
					Reverse Scale( 0 ),
					Excluded Rows( 0 )
				)}
			)
		)
	);
- Tags:
- Mass Customization
1 REPLY 1


Staff
- Mark as New
- Bookmark
- Subscribe
- Mute
- Subscribe to RSS Feed
- Get Direct Link
- Report Inappropriate Content
Re: Dot marker colour not showing up in loop for variability chart.
Did you try using
dt_param_lstin the By role?
Recommended Articles
- © 2026 JMP Statistical Discovery LLC. All Rights Reserved.
- Terms of Use
- Privacy Statement
- Contact Us