- Subscribe to RSS Feed
- Mark Topic as New
- Mark Topic as Read
- Float this Topic for Current User
- Bookmark
- Subscribe
- Mute
- Printer Friendly Page
Discussions
Solve problems, and share tips and tricks with other JMP users.- JMP User Community
- :
- Discussions
- :
- Re: Distribution: how setting a maximum value for the bin?
- Mark as New
- Bookmark
- Subscribe
- Mute
- Subscribe to RSS Feed
- Get Direct Link
- Report Inappropriate Content
Distribution: how setting a maximum value for the bin?
Hello everybody,
I have a continuous variable with values between 0 and 100.
When I look at the Distribution platform, the last bin corresponds to the range [100 ; 110[ With this graphical representation we can believe that there are values higher than 100.
How can we change the axis settings so that the last bin would be [90 ; 100] ? I tried to change the maximum value but it doesn't fix the problem...
Thanks in advance for you help!
- Mark as New
- Bookmark
- Subscribe
- Mute
- Subscribe to RSS Feed
- Get Direct Link
- Report Inappropriate Content
Re: Distribution: how setting a maximum value for the bin?
You can set the bin width, but I don't think there is any way you can customize where the bin limits begin and end. The problem here is that the values that fall in the second to last bin would be written [90, 100), and the last bin would be [100,110). The upper limit is non-inclusive, and there's no way to change that.
An easy, klugey fix would be to subtract a really, really small number off your data points so that the 100 becomes 99.9999999 or something similar. Here's an example where I only subtracted off of the values equal to 100 in a new column I called X_modified. You see the histogram for the original column X (contains random uniform(0,100) values rounded to integers).
Originally, the Quantiles table for X_modified showed the max value = 99.99999999. I addressed that by reducing the the number of digits in the format for that column from 12 to 6. You can change the format by double clicking on the column.
- Mark as New
- Bookmark
- Subscribe
- Mute
- Subscribe to RSS Feed
- Get Direct Link
- Report Inappropriate Content
Re: Distribution: how setting a maximum value for the bin?
Hello Cameron,
Thank you for your answer.
It is a bit tricky but indeed it is a way to solve the problem!
It requires to create and handle new columns each time we want to do that, but if no direct option exists it is a useful loophole.
Thanks for your input!
- Mark as New
- Bookmark
- Subscribe
- Mute
- Subscribe to RSS Feed
- Get Direct Link
- Report Inappropriate Content
Re: Distribution: how setting a maximum value for the bin?
I created a data set to mimic yours. If I double click on the x-axis to get the axis dialog box I set the min = 0, max = 100, increment = 10, and #minor ticks to 0 to get bins of size 10 with the axis running from 0 to 100. You can also use the hand tool (one of my favorite tools for historgrams) to resize the bins (swipe up for more bins, down for fewer, left and right to change where bins start).
- Mark as New
- Bookmark
- Subscribe
- Mute
- Subscribe to RSS Feed
- Get Direct Link
- Report Inappropriate Content
Re: Distribution: how setting a maximum value for the bin?
Hello Karen,
Thanks a lot for your answer.
I also tried to play with the axis settings, however if you set the min to 0 and the max to 100 it will just hide the last bin. If you use then the handle tool to change the scale of the axis the last bin appears. Did I miss something?
Regarding the second part of your answer, I was not aware about the fact that the hand tool can be used to change where bins start. Playing with that tool allows indeed to get something very close to the expected results.
That is great to know, thanks!
- Mark as New
- Bookmark
- Subscribe
- Mute
- Subscribe to RSS Feed
- Get Direct Link
- Report Inappropriate Content
Re: Distribution: how setting a maximum value for the bin?
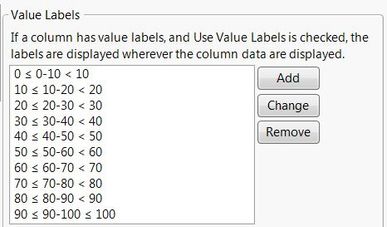
I think you may be able to get what you want by using a combination of Value Labels with ranges and the Hand Tool. I set the Value Labels to the bins that I wanted, and then used the hand tool to move the scale and bins to what I wanted......see below
- Mark as New
- Bookmark
- Subscribe
- Mute
- Subscribe to RSS Feed
- Get Direct Link
- Report Inappropriate Content
Re: Distribution: how setting a maximum value for the bin?
Hello Jim,
Thanks for your answer.
Using the labels is a good idea! Unfortunately I am not able to reproduce exactly what I want.
First I set the Value Labels so that the 100 values should be included in the last bin:
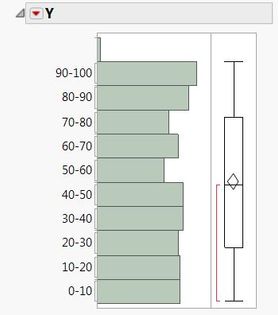
But I still have an additional bin for the 100 values:
If I use then the hand tool, the first bin is associated to "0-10" and "10-20" values which is a bit confusing:
Recommended Articles
- © 2026 JMP Statistical Discovery LLC. All Rights Reserved.
- Terms of Use
- Privacy Statement
- Contact Us


