Turn on suggestions
Auto-suggest helps you quickly narrow down your search results by suggesting possible matches as you type.
- Don’t miss your chance to experience Discovery Summit Europe at our best available rate! Early bird registration through 31 Oct.
- Graph Builder Toolbar streamlines interactive graphing. Creates shortcuts on Report and GraphBuilder Helpers toolbars. Download and install the extension.
- JMP will suspend normal business operations for our Rest and Recharge Day on Friday, October 2, 2026.
Regular business hours will resume on Monday, October 5, 2026.
Options
- Subscribe to RSS Feed
- Mark Topic as New
- Mark Topic as Read
- Float this Topic for Current User
- Bookmark
- Subscribe
- Mute
- Printer Friendly Page
Discussions
Solve problems, and share tips and tricks with other JMP users.- User Community
- :
- Discussions
- :
- Direct visualization of summary table results

Level VI
- Mark as New
- Bookmark
- Subscribe
- Mute
- Subscribe to RSS Feed
- Get Direct Link
- Report Inappropriate Content
Direct visualization of summary table results
Created:
Sep 9, 2021 03:46 AM
| Last Modified: Jun 11, 2023 4:17 AM
(1691 views)
I would like to know how to visualize aggregated results directly.
For example, let's say I want to obtain the maximum value of the ethanol per batch (fermentation sample data set).
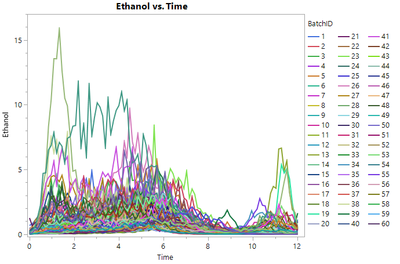
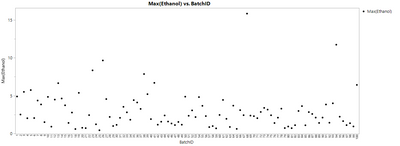
As of today, I create a summary table or perform a tabulate analysis before doing the graph.
Data Table( "Fermentation Process" ) << Summary(
	Group( :BatchID ),
	Max( :Ethanol ),
	Freq( "None" ),
	Weight( "None" )
)
One point per batch.
However, I can use a JMP formula with column functions grouped by variables.
Col Maximum( :Ethanol, :BatchID )If I plot these, I will have the aggregated result repeated (sample points per batch).
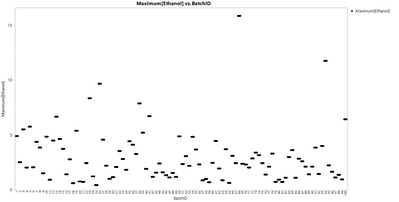
Any ideas on how to plot the aggregated results directly so I have one point per batch?
I prefer to avoid having to handle several data tables.
1 ACCEPTED SOLUTION
Accepted Solutions
Level VI
Solution
- Mark as New
- Bookmark
- Subscribe
- Mute
- Subscribe to RSS Feed
- Get Direct Link
- Report Inappropriate Content
Re: Direct visualization of summary table results
1 REPLY 1
Level VI
Solution
- Mark as New
- Bookmark
- Subscribe
- Mute
- Subscribe to RSS Feed
- Get Direct Link
- Report Inappropriate Content
Re: Direct visualization of summary table results
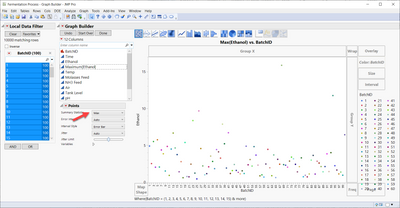
It was really simple.
Recommended Articles
- © 2026 JMP Statistical Discovery LLC. All Rights Reserved.
- Terms of Use
- Privacy Statement
- Contact Us