- Subscribe to RSS Feed
- Mark Topic as New
- Mark Topic as Read
- Float this Topic for Current User
- Bookmark
- Subscribe
- Mute
- Printer Friendly Page
Discussions
Solve problems, and share tips and tricks with other JMP users.- JMP User Community
- :
- Discussions
- :
- D-optimal or I-optimal design for minimal prediction variance at the limits of t...
- Mark as New
- Bookmark
- Subscribe
- Mute
- Subscribe to RSS Feed
- Get Direct Link
- Report Inappropriate Content
D-optimal or I-optimal design for minimal prediction variance at the limits of the factors of interest
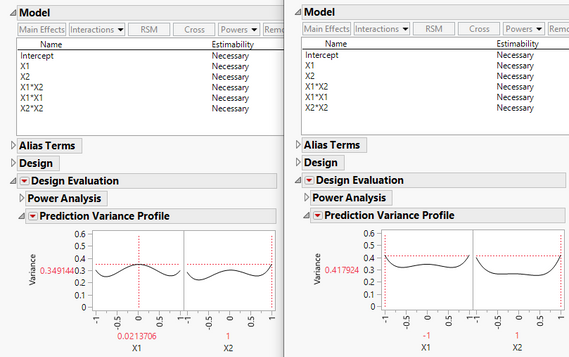
In the JMP technical details it says that D-optimality focuses on precise estimates of the effects whereas I-optimal designs minimize the average variance of prediction over the design space. Let's assume that I have two factors X1 and X2, vary each of them for example by +/-20% and want to have a precise prediction of my response exactly at the limits of my factor variation, i.e., at -20% and +20%. Let's also assume that I have 2nd order quadratic effects and the interaction in the model and can do 20 runs. Example in JMP in the screenshot (left: D-optimal, right: I-optimal). As we can see, the maximum relative prediction variance at the limits of the factor values is higher for the I-optimal design, as the average prediction variance is minimized.
Is there another optimality criterion that could be chosen in order to reach that goal or do you have some other advice? My first idea would be to choose an I-optimal model and place some additional measurement runs manually at the limits for each factor.
Kind regards,
Tina
- Mark as New
- Bookmark
- Subscribe
- Mute
- Subscribe to RSS Feed
- Get Direct Link
- Report Inappropriate Content
Re: D-optimal or I-optimal design for minimal prediction variance at the limits of the factors of interest
This is an interesting question. To compare the prediction variance profiles for the two designs, I prefer to look at the Fraction of Design Space Plot. I have a D-optimal, I-optimal, and an A-optimal design shown for your situation:
This shows that although the D-Optimal design does slightly better at the edge of the design space, the I-Optimal design is far superior in terms of the prediction variance. The A-optimal is interesting, but is also worse than D-optimal at the VERY edge of the design space. So how much of a gambler are you that the optimal actually occurs at the edge? And if you are very confident of that, why would you not center your design at that location instead? Further, why go to +/- 20% if you "know" the optimal is at an edge in the first place?
I-optimal designs create a design with minimum integrated variance. Think of the FPS plot shown above. I-optimal will keep the area below the curve at a minimum. A-optimal designs have the effect of minimizing the variance of the parameter estimates which leads to good prediction variance properties, just not optimal. I don't know of any design criteria that tries to minimize the prediction variance right at the boundary of the design space. There probably is something out there that will do that (or can be shown to do that -- I would not be surprised if D-optimal designs actually do that). It just seems to me that a design that does that would have limited practical use.
- Mark as New
- Bookmark
- Subscribe
- Mute
- Subscribe to RSS Feed
- Get Direct Link
- Report Inappropriate Content
Re: D-optimal or I-optimal design for minimal prediction variance at the limits of the factors of interest
Thanks @Dan_Obermiller for your answer and the considerations!
With my question I did not want to indicate that I assume that the optimal factor setting is at the edge, but rather I want to have a model with that I can have very precise predictions at the edges. I agree that with an I-optimal design the prediction variance is far better as we can see in the plot you shared. Therefore, the I-optimal design would be my first choice in my scenario. Moreover, I agree that it's important to put focus on the center to get precise predictions and be able to estimate the RSM best. However, I was wondering if there was an idea other than adding additional points manually in order to tell if my response falls out of it specs especially if I go to the limits for my factors.
- Mark as New
- Bookmark
- Subscribe
- Mute
- Subscribe to RSS Feed
- Get Direct Link
- Report Inappropriate Content
Re: D-optimal or I-optimal design for minimal prediction variance at the limits of the factors of interest
Since you are looking for ideas, here is an idea. What if you created a 10 run I-optimal design for your quadratic model and created another 10-run D-optimal design for the quadratic model and concatenated the two? Your idea of manually replicating endpoints made me think of this approach.
The resulting 20 run design has this FDS:
It improves the prediction at the edge, but at the cost of higher variance over 70% of the design space. I'm not sure that kind of trade-off is worth it. I enclosed the full journal for further exploration.
Ultimately, I-Optimal has optimal in its title for a reason. To get better prediction variance at the edge, it will have to come at a cost for the rest of the design space. Ultimately, that cost would likely make the combination less attractive overall.
Recommended Articles
- © 2026 JMP Statistical Discovery LLC. All Rights Reserved.
- Terms of Use
- Privacy Statement
- Contact Us


