- New to JMP? Join us Sept. 23-24 for the Early User Edition of Discovery Summit, tailor-made for new users. Register now for free!
- Your voice matters! Tell us how you prefer to receive JMP updates, so we can tailor our communication to your needs. Take short survey.
- See how to access JMP Marketplace - and - find, create & share add-ins to extend your JMP. Watch video.
- Subscribe to RSS Feed
- Mark Topic as New
- Mark Topic as Read
- Float this Topic for Current User
- Bookmark
- Subscribe
- Mute
- Printer Friendly Page
Discussions
Solve problems, and share tips and tricks with other JMP users.- JMP User Community
- :
- Discussions
- :
- Re: , IRe: Creating Summary Table for Line of Fit?

- Mark as New
- Bookmark
- Subscribe
- Mute
- Subscribe to RSS Feed
- Get Direct Link
- Report Inappropriate Content
Creating Summary Table for Line of Fit?
Hello,
I have a script that generates Graphs using Graph Builder and Bivariate in a window. The function is shown below. Sorry if it is confusing, I had to hide the actual column and data table names. Essentially, the data table called upon in the function contains different lot numbers in rows, and different tests in columns.The function generates a graph for each test parameter vs time, and also generates Bivariate analyses for each graph which contain the Linear regression statistics (equation of line, R squared, p-value).
setup = Function({dt}, {Default Local},

	dt = Open ( "Product_example.JMP" );
	dt << Select Where(:"Example_column" == "Example_value" );
	cfg1 = EvalList({dt << Data View, { "List of columns would be here" }});
	EvalList({cfg1});

);

build_graphs = Function({cfgs}, {Default Local},
	win = New Window( "Product", vlb = V List Box() );

	ncfg = NItems(cfgs);

	for(i = 1, i <= ncfg, i++,
		{this_dt, this_cols} = cfgs[i];
		ncols = NItems(this_cols);
		for(j = 1, j <= ncols, j++,
			vlb << Append(H List Box (
					this_dt << Graph Builder(
						Show Control Panel( 0 ),
						Size( 600, 400),
						Variables(
							X( :"Time" ),
							Y( Column(this_dt, this_cols[j]) ),
							Overlay( :"Lot Number" )
						),
						Elements(
							Points( X, Y, Legend(12) ),
							Line Of Fit( X, Y, Legend(10), Confidence of Fit(0), F Test(1))
						),
						SendToReport(
							Dispatch(
								{},
								"Time",
								ScaleBox,
								{Format( "Fixed Dec", 10, 0 ), Min(0), Max(50), Inc(6),
								Minor Ticks(0)}
								)
							)
						),
						this_dt << Bivariate(
							invisible,
							Y( Column(this_dt, this_cols[j])),
							X( :"Time" ),
							By( :"Lot Number" ),
							Fit Line( {Line Color( {213, 72, 87} )} )
						)));
			)
		);
		win
	);


dt = Open ( "Product_example.JMP" );
cfgs = setup(dt);
Show(cfgs);
win = build_graphs(cfgs);
Show(win);
win << Save Journal("Product_example.jrn", embed data(1));
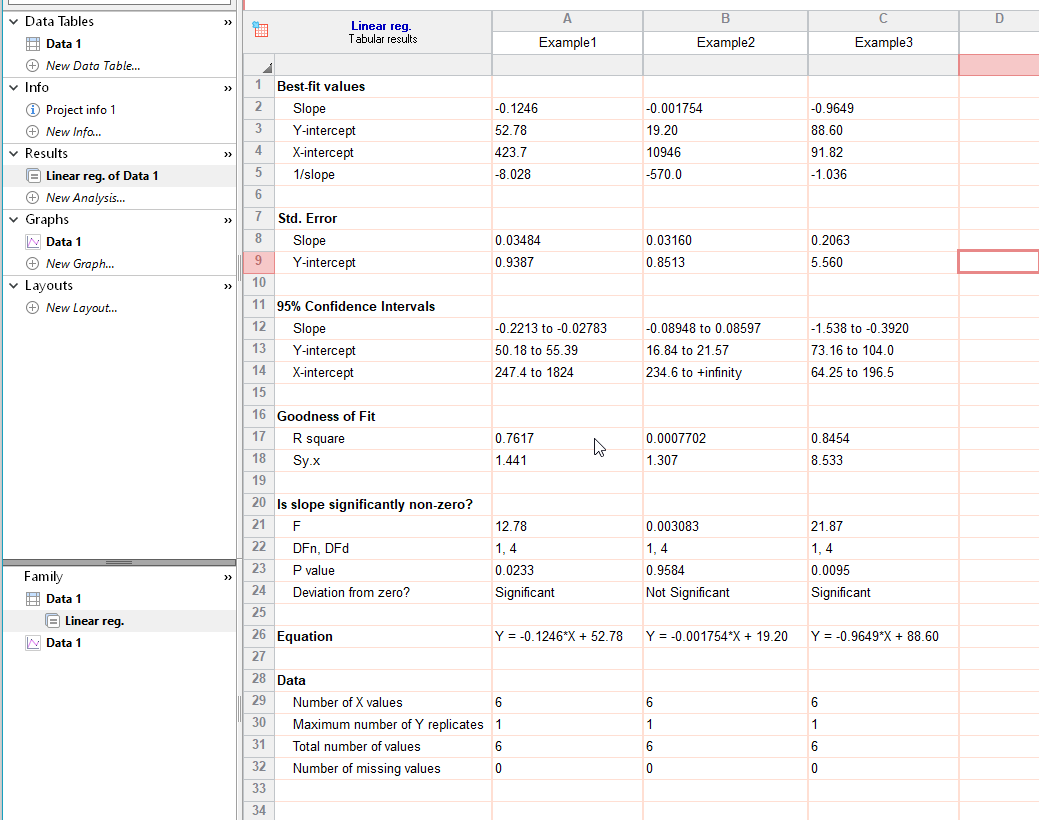
I am trying to see if it is possible to create something similar to a summary table which summaries all the linear regression statistics for each Lot Number. For example, Graph Builder allows you to show Elements like F-test (p-value) on top of the graph, but is it possible to store this values in a table rather than on top of the graph? Right now I am generating the Bivariate analysis to get these statistics, because I could not figure out a way to extract them from Graph Builder.
Just to give an example of what I am trying to accomplish, I attached an image from a different software 'Graphpad Prism'. When you perform an analysis on your data in GraphPad, a results table is generated which contains the line equation, R square, P value, etc.

- Mark as New
- Bookmark
- Subscribe
- Mute
- Subscribe to RSS Feed
- Get Direct Link
- Report Inappropriate Content
Re: Creating Summary Table for Line of Fit?
I'm not sure if this is what you want, but if you use Fit Model and use Lot Number as a By Variable, you'll get a regression model for each lot number. If you right click in the parameter estimates table for one of the models, choose Make into Combined Data Table. You can then use Graph Builder to graph parameter values, confidence intervals, p-values, etc. across the different regression models.
- Mark as New
- Bookmark
- Subscribe
- Mute
- Subscribe to RSS Feed
- Get Direct Link
- Report Inappropriate Content
, IRe: Creating Summary Table for Line of Fit?
Hmm, I'm not sure if this will work. I tried using Fit Model, but there is no option for X variable, and I am trying to do a Y by X analysis.
- Mark as New
- Bookmark
- Subscribe
- Mute
- Subscribe to RSS Feed
- Get Direct Link
- Report Inappropriate Content
Re: , IRe: Creating Summary Table for Line of Fit?
The X variable goes where the Model Effects are.
- Mark as New
- Bookmark
- Subscribe
- Mute
- Subscribe to RSS Feed
- Get Direct Link
- Report Inappropriate Content
Re: , IRe: Creating Summary Table for Line of Fit?
Ah interesting, I got it to work. I will try to implement this in my script to replace the Bivariate portion.
Recommended Articles
- © 2026 JMP Statistical Discovery LLC. All Rights Reserved.
- Terms of Use
- Privacy Statement
- Contact Us