- Discovery Summit 2026: Early User Edition - September 23-24.Register. It's free.
- Graph Builder Toolbar streamlines interactive graphing. Creates shortcuts on Report and GraphBuilder Helpers toolbars. Download and install the extension.
- Subscribe to RSS Feed
- Mark Topic as New
- Mark Topic as Read
- Float this Topic for Current User
- Bookmark
- Subscribe
- Mute
- Printer Friendly Page
Discussions
Solve problems, and share tips and tricks with other JMP users.- User Community
- :
- Discussions
- :
- Re: Contour map creation in JSL brings up MIN/MAX/#LAYERS diaglog for each graph

- Mark as New
- Bookmark
- Subscribe
- Mute
- Subscribe to RSS Feed
- Get Direct Link
- Report Inappropriate Content
Contour map creation in JSL brings up MIN/MAX/#LAYERS diaglog for each graph
directory = "C:\TEST\";

fileNames = Files In Directory( directory );

For( iFile = 1, iFile <= N Items( fileNames ), iFile++,

  filename = fileNames[iFile];

  If( Ends With( filename, ".csv" ),

    dt = Open( directory || filename );
	max = Col Max(Column( dt,4));
	min = Col Min(Column( dt,4));
	dt:DC_0VDC << Format( "Engineering", 12 );
	dt:DC_1VDC << Format( "Engineering", 12 );
	dt:DC_3VDC << Format( "Engineering", 12 );
	dt << Contour Plot(
		X( :X, :Y),
		Y( :DC_1VDC ),
		Legend( 2 ),
		Show Contours( 1 ),
		Show Data Points( 1 ),
		Fill Areas( 1 ),
		Label Contours( 0 ),
		Color Theme( "Blue White Red" ),
		Specify Contours( min, max, N( 4 ) ),
	);

    //Close( dt, "nosave" );

  );
);
This JSL opens .CSV files in a directory and plots contour graphs for each.
The issue is that a dialog box opens to confirm the MAX/MIN and # of contour layers for each plot.
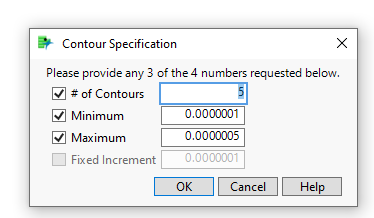
How do you prevent this from happening?
Thankyou.
Accepted Solutions


- Mark as New
- Bookmark
- Subscribe
- Mute
- Subscribe to RSS Feed
- Get Direct Link
- Report Inappropriate Content
Re: Contour map creation in JSL brings up MIN/MAX/#LAYERS diaglog for each graph
You might have to use separate << Specify Contours.
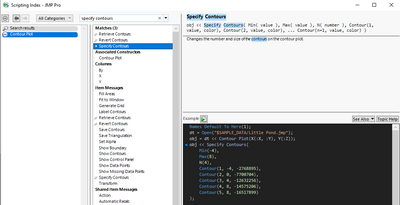
Slightly modified from scripting index example:
Names Default To Here(1);
dt = Open("$SAMPLE_DATA/Little Pond.jmp");
obj = dt << Contour Plot(X(:X, :Y), Y(:Z));
min_c = -4;
max_c =8;
obj << Specify Contours(
	Min(min_c),
	Max(max_c),
	N(4)
);
Edit:
You seem to be missing Min and Max from the command and this seems to work also:
Names Default To Here(1);
dt = Open("$SAMPLE_DATA/Little Pond.jmp");
min_c = -4;
max_c = 8;

obj = dt << Contour Plot(X(:X, :Y), Y(:Z), Specify Contours(Min(min_c), Max(max_c), N(4)));

- Mark as New
- Bookmark
- Subscribe
- Mute
- Subscribe to RSS Feed
- Get Direct Link
- Report Inappropriate Content
Re: Contour map creation in JSL brings up MIN/MAX/#LAYERS diaglog for each graph
The Specify Contours message needs to be specified outside of the Contour Plot definition.
	cp = dt << Contour Plot(
		X( :X, :Y),
		Y( :DC_1VDC ),
		Legend( 2 ),
		Show Contours( 1 ),
		Show Data Points( 1 ),
		Fill Areas( 1 ),
		Label Contours( 0 ),
		Color Theme( "Blue White Red" );
xp << Specify Contours( min, max, N( 4 ) ));- Mark as New
- Bookmark
- Subscribe
- Mute
- Subscribe to RSS Feed
- Get Direct Link
- Report Inappropriate Content
Re: Contour map creation in JSL brings up MIN/MAX/#LAYERS diaglog for each graph
You might have to use separate << Specify Contours.
Slightly modified from scripting index example:
Names Default To Here(1);
dt = Open("$SAMPLE_DATA/Little Pond.jmp");
obj = dt << Contour Plot(X(:X, :Y), Y(:Z));
min_c = -4;
max_c =8;
obj << Specify Contours(
	Min(min_c),
	Max(max_c),
	N(4)
);
Edit:
You seem to be missing Min and Max from the command and this seems to work also:
Names Default To Here(1);
dt = Open("$SAMPLE_DATA/Little Pond.jmp");
min_c = -4;
max_c = 8;

obj = dt << Contour Plot(X(:X, :Y), Y(:Z), Specify Contours(Min(min_c), Max(max_c), N(4)));
- Mark as New
- Bookmark
- Subscribe
- Mute
- Subscribe to RSS Feed
- Get Direct Link
- Report Inappropriate Content
Re: Contour map creation in JSL brings up MIN/MAX/#LAYERS diaglog for each graph
The Specify Contours message needs to be specified outside of the Contour Plot definition.
	cp = dt << Contour Plot(
		X( :X, :Y),
		Y( :DC_1VDC ),
		Legend( 2 ),
		Show Contours( 1 ),
		Show Data Points( 1 ),
		Fill Areas( 1 ),
		Label Contours( 0 ),
		Color Theme( "Blue White Red" );
xp << Specify Contours( min, max, N( 4 ) ));Recommended Articles
- © 2026 JMP Statistical Discovery LLC. All Rights Reserved.
- Terms of Use
- Privacy Statement
- Contact Us