- New to JMP? Join us Sept. 23-24 for the Early User Edition of Discovery Summit, tailor-made for new users. Register now for free!
- Subscribe to RSS Feed
- Mark Topic as New
- Mark Topic as Read
- Float this Topic for Current User
- Bookmark
- Subscribe
- Mute
- Printer Friendly Page
Discussions
Solve problems, and share tips and tricks with other JMP users.- JMP User Community
- :
- Discussions
- :
- Re: Continuous fit of distribution fails to select best fit?

- Mark as New
- Bookmark
- Subscribe
- Mute
- Subscribe to RSS Feed
- Get Direct Link
- Report Inappropriate Content
Continuous fit of distribution fails to select best fit?
I played around to understand nature of experimental Distribution and used the nice workflow in JMP Pro 15.0 at Win10 for it (continuous fit --> fit all).
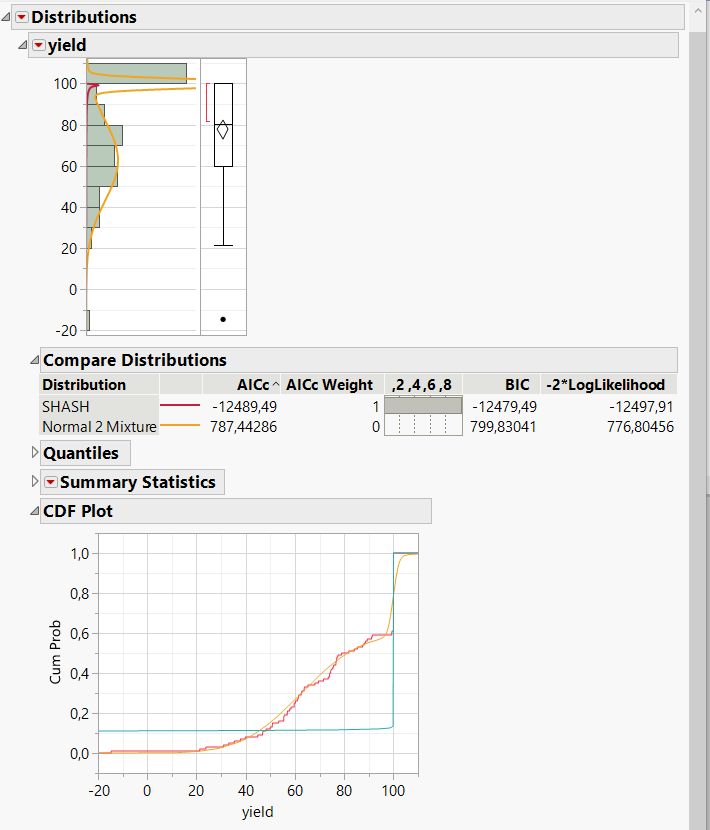
JMP showed SHASH Distribution as best fit, where I found mixed normal to fit better.
I was able to reconstruct the Problem with a modelled Distribution, see script below.
Perhaps negative AIC is the Problem? In the Manual (chapter 3 Basic Analysis, Distributions, p91) I found also that the weighted AIC for the best Distribution is most near to 1. It is the case for SHASH, but it visually and really is wrong, I think.
Any Suggestion what the Problem is?
Names Default To Here( 1 );

// Compose a distribution with 70 rows random normal, and 30 rows fixed values
Vec = J( 1, 70, Random Normal( 70, 25 ) ) || J( 1, 30, 100 );

// this distribution 70/10 would let JMP take the right guess, but with too small difference in AIC?
// Vec = J( 1, 70, Random Normal( 70, 25 ) ) || J( 1, 10, 100 );

// cut off values larger than 100
Vec[Loc( Vec > 100 )] = 100;

// Put it into table
dty = New Table( "yield_distribution", New Column( "yield", set values( Vec ) ) );

dty << Add Properties to Table(
	{New Script(
		"Distributions_SHASHvsNormal",
		Distribution(
			Continuous Distribution( Column( :yield ), CDF Plot( 1 ), Fit Normal 2 Mixture, Fit SHASH ),
			SendToReport(
				Dispatch( {"yield"}, "Quantiles", OutlineBox, {Close( 1 )} ),
				Dispatch( {"yield"}, "Summary Statistics", OutlineBox, {Close( 1 )} ),
				Dispatch( {"yield"}, "Fitted Normal 2 Mixture Distribution", OutlineBox, {Close( 1 )} ),
				Dispatch(
					{"yield", "CDF Plot"},
					"Distrib CDF",
					FrameBox,
					{DispatchSeg(
						TopSeg( 2 ),
						{Set Script(
							Pen Size( 1 );
							Pen Color( -2600622 );
							Y Function( SHASH Distribution( X, 1.13512094644709, 0.0115544235279409, 100, 9.38305371818249e-80 ), X );
						)}
					)}
				)
			)
		)
	)}
);

dty << run script( "Distributions_SHASHvsNormal" );
Accepted Solutions

- Mark as New
- Bookmark
- Subscribe
- Mute
- Subscribe to RSS Feed
- Get Direct Link
- Report Inappropriate Content
Re: Continuous fit of distribution fails to select best fit?
AICc is one criterion. There is nothing wrong with a negative AICc, by the way.
The SHASH model is clearly superior to the normal mixture model using this criterion. And BIC. And negative log-likelihood. It is also the reason for the disparity in the AICc weights, which might be used for an ensemble distribution model.
What is your criterion for choosing the normal mixture model? It does not look that good to me. Furthermore, I know that it is a poor model on first principles. The data is a combination of 70% normal( 75, 25 ) and 30% 100, not a combination of two normal distributions. This distribution is more like a zero-inflated distribution, but at the other extreme value. The first distribution exceeds 100 and the second distribution has a non-zero width.

So the mixture model would not be useful for estimation in the tails.
On the other hand, the SHASH model respects the limit of 100. If the plot of the PDF appears to disagree with the histogram, remember that the choice of the bins determines our impression but is a difficult algorithm. You can manually over-ride the number of bins.
It seems that SHASH is the better choice of the two candidates, but neither one is likely a good model for this data.
- Mark as New
- Bookmark
- Subscribe
- Mute
- Subscribe to RSS Feed
- Get Direct Link
- Report Inappropriate Content
Re: Continuous fit of distribution fails to select best fit?
AICc is one criterion. There is nothing wrong with a negative AICc, by the way.
The SHASH model is clearly superior to the normal mixture model using this criterion. And BIC. And negative log-likelihood. It is also the reason for the disparity in the AICc weights, which might be used for an ensemble distribution model.
What is your criterion for choosing the normal mixture model? It does not look that good to me. Furthermore, I know that it is a poor model on first principles. The data is a combination of 70% normal( 75, 25 ) and 30% 100, not a combination of two normal distributions. This distribution is more like a zero-inflated distribution, but at the other extreme value. The first distribution exceeds 100 and the second distribution has a non-zero width.
So the mixture model would not be useful for estimation in the tails.
On the other hand, the SHASH model respects the limit of 100. If the plot of the PDF appears to disagree with the histogram, remember that the choice of the bins determines our impression but is a difficult algorithm. You can manually over-ride the number of bins.
It seems that SHASH is the better choice of the two candidates, but neither one is likely a good model for this data.
- Mark as New
- Bookmark
- Subscribe
- Mute
- Subscribe to RSS Feed
- Get Direct Link
- Report Inappropriate Content
Re: Continuous fit of distribution fails to select best fit?
@Mark_Bailey thanks for the answer, you're Right, it is not really a normal Distribution, but also not that far away I think.
Motivation for me is to Read out of the fitted Distribution some local maxima, and mixed normal model does that. I.e. some local maximum means some higher Density of yield at a certain value leading to one isolated cause for that yield Problem. Supposed the yield Distribution consists of several Independent causes at certain Level, each normally distributed.
Looking at the CDF gives the best visual Impression for what I meant. There I see that mixed model is better (the orange model better fits the red curve than the mint one does).
And JMP algorithim with SHASH models the sharp Edge at 100 best. I was surprised by that discovery. Seems that values at 100 get more importance (because there is much area I did not see in the graph below).
But to do it Right in future, I should probably remove the values "100" from my real Distribution and try to make the fit again.

- Mark as New
- Bookmark
- Subscribe
- Mute
- Subscribe to RSS Feed
- Get Direct Link
- Report Inappropriate Content
Re: Continuous fit of distribution fails to select best fit?
You said, "Seems that values at 100 get more importance (because there is much area I did not see in the graph below)." Well, they are 30% of the mass!
- Mark as New
- Bookmark
- Subscribe
- Mute
- Subscribe to RSS Feed
- Get Direct Link
- Report Inappropriate Content
Re: Continuous fit of distribution fails to select best fit?
I reached out to JMP Technical Support for confirmation. They are willing to pursue this question further if you want to contact them about this matter ([email protected]).
Recommended Articles
- © 2026 JMP Statistical Discovery LLC. All Rights Reserved.
- Terms of Use
- Privacy Statement
- Contact Us