- New to JMP? Join us Sept. 23-24 for the Early User Edition of Discovery Summit, tailor-made for new users. Register now for free!
- Subscribe to RSS Feed
- Mark Topic as New
- Mark Topic as Read
- Float this Topic for Current User
- Bookmark
- Subscribe
- Mute
- Printer Friendly Page
Discussions
Solve problems, and share tips and tricks with other JMP users.- JMP User Community
- :
- Discussions
- :
- Re: Comparison of a D-Optimal and an I-Optimal Response Surface Design

- Mark as New
- Bookmark
- Subscribe
- Mute
- Subscribe to RSS Feed
- Get Direct Link
- Report Inappropriate Content
Comparison of a D-Optimal and an I-Optimal Response Surface Design
Hello! I've been reading the example posted on your website regarding design evaluation of D-optimal and I-optimal designs (https://www.jmp.com/support/help/en/16.2/index.shtml#page/jmp/comparison-of-a-doptimal-and-an-ioptim...)
Somewhere in that post, it compares the relative prediction variance of both designs and states: "...This means that the relative standard error is 0.732 for the D-optimal design and 0.456 for the I-optimal design..." furthermore, it finishes saying something like "...confidence intervals for the expected response based on the D-optimal design are about 60% wider..."
May I understand how those values (expected response CI and relative standard error (RSE) are computed??)
In the case of the RSE, would you be so kind to share what's the appropriate interpretation of that value?
Thanks and regards!
Accepted Solutions

- Mark as New
- Bookmark
- Subscribe
- Mute
- Subscribe to RSS Feed
- Get Direct Link
- Report Inappropriate Content
Re: Comparison of a D-Optimal and an I-Optimal Response Surface Design
And to finish the explanation and to emphasize the importance of relative comparison of designs mentioned by @Phil_Kay :
"Somewhere in that post, it compares the relative prediction variance of both designs and states: "...This means that the relative standard error is 0.732 for the D-optimal design and 0.456 for the I-optimal design..." furthermore, it finishes saying something like "...confidence intervals for the expected response based on the D-optimal design are about 60% wider..."
Since it states confidence intervals for D-optimal design are about 60% wider compared to I-optimal design, let's figure out from where it comes with the equations I mentioned before with a short calculation (sorry for the formatting):
- Width CI [D-opt] / Width CI [I-opt] = Predicted StdError (D-opt) / Predicted StdError (I-opt)
- = Square_root(Predicted variance [D-opt]) / Square_root(Predicted variance I-opt)
- = Square_root(Relative Predictive Variance [D-opt] x MSE [D-opt]) / Square_root(Relative Predictive Variance [I-opt] x MSE [I-opt])
At this stage, we have supposed that degree of freedoms and terms in both designs are the same, and we suppose that the Mean Square of Error for both models will be equivalent, so MSE [D-opt] = MSE [I-opt].
We now have :
- = Square_root(Relative Predictive Variance [D-opt]) / Square_root(Relative Predictive Variance [I-opt])
If we replace these terms by their values in the case from JMP help :
- = Square_root(0,53562) / Square_root(0,20833) = 0,732 / 0,456 = 1,60
So dividing the width of confidence interval for D-optimal design by the width of confidence interval for I-optimal design gives us 1,60 which means that we found effectively that confidence intervals for the expected response based on the D-optimal design are about 60% wider than those for I-optimal design (if we assume equivalent models for both designs, meaning same number of terms, same degree of freedoms and same MSE for D and I-optimal models).
Hope this finally clarifies the sentence you mentioned :)
"It is not unusual for a well-designed experiment to analyze itself" (Box, Hunter and Hunter)
- Mark as New
- Bookmark
- Subscribe
- Mute
- Subscribe to RSS Feed
- Get Direct Link
- Report Inappropriate Content
Re: Comparison of a D-Optimal and an I-Optimal Response Surface Design
Hello @Mariana_Aguilar and welcome in the community !
You'll find answers to your questions here : https://www.jmp.com/support/help/en/16.2/index.shtml#page/jmp/prediction-variance-profile.shtml#ww16...
The relative variance prediction is helpful to compare precision/predictive performance of several designs in the experimental space, since it doesn't depend on the response.
Hope it helps you,
"It is not unusual for a well-designed experiment to analyze itself" (Box, Hunter and Hunter)
- Mark as New
- Bookmark
- Subscribe
- Mute
- Subscribe to RSS Feed
- Get Direct Link
- Report Inappropriate Content
Re: Comparison of a D-Optimal and an I-Optimal Response Surface Design
Hello Victor! thank you for your answer and warm welcome!
I hope you don't mind me asking again but I haven't quite understood how the confident intervals for the expected response and Relative Standard Errors are calculated? Is that something you can see on the JMP evaluate design window? If that's so, would you mind sharing where? I haven't found it so far...
Thanks and regards!
Mariana
- Mark as New
- Bookmark
- Subscribe
- Mute
- Subscribe to RSS Feed
- Get Direct Link
- Report Inappropriate Content
Re: Comparison of a D-Optimal and an I-Optimal Response Surface Design
Hello @Mariana_Aguilar,
The help of JMP technical staff may be helpful here, to be sure I'm not writing something wrong. @Phil_Kay, @Mark_Bailey ?
I will use the dataset DOE "Bounce Data.jmp" (in the Sample Data Directory, and attached here with the formula) to explain the calculations I have found. From what I understand :
- For confidence intervals, they seem to be constructed with the predicted mean +/- 2.365 x Predicted StandardError (for a 95% confidence interval).
Here, 2.365 is the value of a 2 tailed t-test for t-distribution with a confidence level of 95% with 7 degree of freedom (there are 7 degree of freedom for total error estimation in this DoE). T-table used for manual calculation can be found here : tt.pdf (uregina.ca)
- For the actual variance of prediction, "you can estimate the error variance using the mean squared error (MSE) of the model fit. You can estimate the actual variance of prediction at any setting by multiplying the relative variance of prediction at that setting." (source: Prediction Variance Profile (jmp.com))
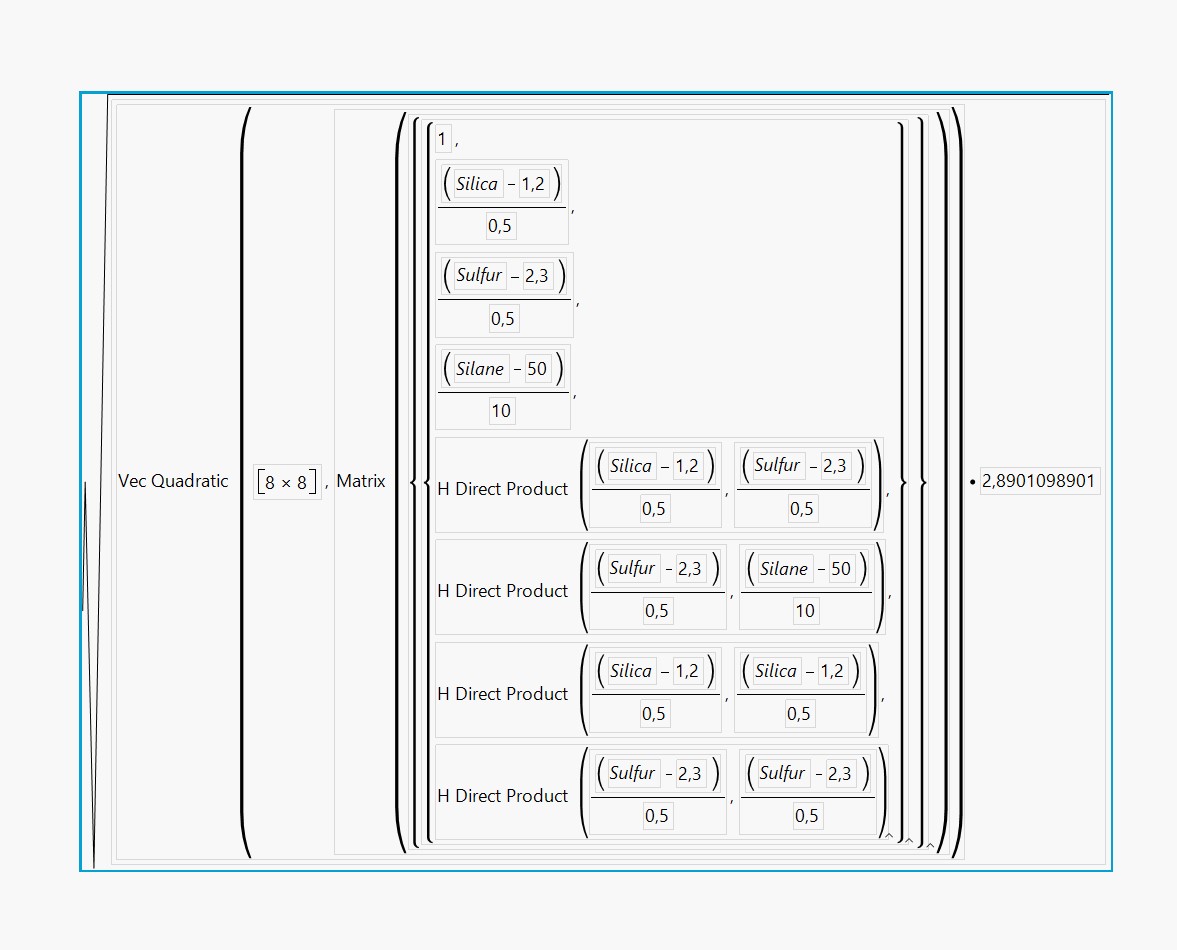
So multiplying MSE (or RMSE²) of the prediction model (here with this DoE and model, RMSE = 1,7 so MSE = 2,89) with the relative variance of prediction (Relative Prediction Variance (jmp.com)) at specific seetings (calculated directly in the Design Evaluation platform without any input response) should give you the actual variance of prediction at these settings.
The square root of this value should give you the Predicted StandardError (see screenshot Predicted_StdError_Formula.jpg), and from then you can calculate confidence intervals.
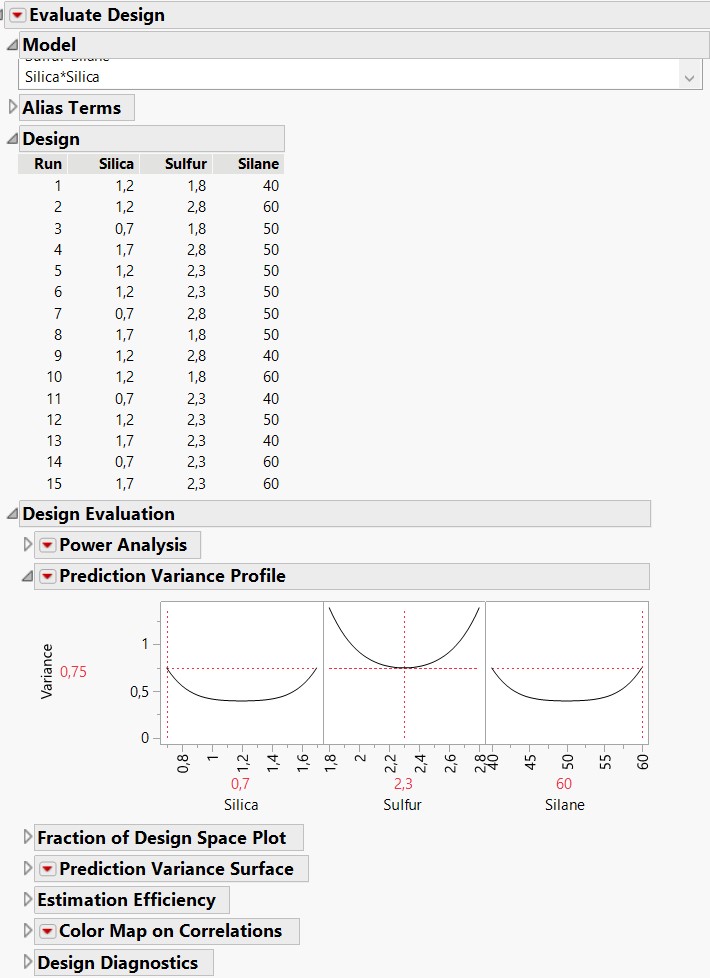
Relative variance prediction over the experimental space can be found quickly when clicking on "Evaluate Design" (directly on the datatable or in DoE -> Design Diagnostics -> Evaluate Design and specifying the factors), under "Design Evaluation" panel, in the "Prediction Variance Profile" part (see screenshot Prediction_Variance_Profile) :)
I hope to have avoided mistakes in the calculations or understanding and that it may help you,
"It is not unusual for a well-designed experiment to analyze itself" (Box, Hunter and Hunter)

- Mark as New
- Bookmark
- Subscribe
- Mute
- Subscribe to RSS Feed
- Get Direct Link
- Report Inappropriate Content
Re: Comparison of a D-Optimal and an I-Optimal Response Surface Design
Good answer, @Victor_G .
I think these are some really complex concepts and not easy to explain. For people that want to know more about these topics I always recommend the book Optimal Design of Experiments: A Case Study Approach by Goos & Jones.
Other than that I would just say that you should worry less about the absolute value of design diagnostics and more about the relative value in comparison to another alternative design.
The case that you mention is a good illustration of the difference between I-optimal and D-optimal. The confidence intervals will be wider with D-optimal. This comparison of relative values is informative. But you are very unlikely to have enough information to have a good estimate of the absolute width of the confidence intervals before you have run the experiment.
I hope that helps,
Phil
- Mark as New
- Bookmark
- Subscribe
- Mute
- Subscribe to RSS Feed
- Get Direct Link
- Report Inappropriate Content
Re: Comparison of a D-Optimal and an I-Optimal Response Surface Design
And to finish the explanation and to emphasize the importance of relative comparison of designs mentioned by @Phil_Kay :
"Somewhere in that post, it compares the relative prediction variance of both designs and states: "...This means that the relative standard error is 0.732 for the D-optimal design and 0.456 for the I-optimal design..." furthermore, it finishes saying something like "...confidence intervals for the expected response based on the D-optimal design are about 60% wider..."
Since it states confidence intervals for D-optimal design are about 60% wider compared to I-optimal design, let's figure out from where it comes with the equations I mentioned before with a short calculation (sorry for the formatting):
- Width CI [D-opt] / Width CI [I-opt] = Predicted StdError (D-opt) / Predicted StdError (I-opt)
- = Square_root(Predicted variance [D-opt]) / Square_root(Predicted variance I-opt)
- = Square_root(Relative Predictive Variance [D-opt] x MSE [D-opt]) / Square_root(Relative Predictive Variance [I-opt] x MSE [I-opt])
At this stage, we have supposed that degree of freedoms and terms in both designs are the same, and we suppose that the Mean Square of Error for both models will be equivalent, so MSE [D-opt] = MSE [I-opt].
We now have :
- = Square_root(Relative Predictive Variance [D-opt]) / Square_root(Relative Predictive Variance [I-opt])
If we replace these terms by their values in the case from JMP help :
- = Square_root(0,53562) / Square_root(0,20833) = 0,732 / 0,456 = 1,60
So dividing the width of confidence interval for D-optimal design by the width of confidence interval for I-optimal design gives us 1,60 which means that we found effectively that confidence intervals for the expected response based on the D-optimal design are about 60% wider than those for I-optimal design (if we assume equivalent models for both designs, meaning same number of terms, same degree of freedoms and same MSE for D and I-optimal models).
Hope this finally clarifies the sentence you mentioned :)
"It is not unusual for a well-designed experiment to analyze itself" (Box, Hunter and Hunter)
- Mark as New
- Bookmark
- Subscribe
- Mute
- Subscribe to RSS Feed
- Get Direct Link
- Report Inappropriate Content
Re: Comparison of a D-Optimal and an I-Optimal Response Surface Design
!Thank you both for your kind support! Very much appreciated :)
Recommended Articles
- © 2026 JMP Statistical Discovery LLC. All Rights Reserved.
- Terms of Use
- Privacy Statement
- Contact Us