- Instantly extract effect sizes, F-ratios, and FDR-adjusted p-values from your models with the Calculate Effects Sizes extension, available now in the JMP Marketplace!
- New to JMP? Join us Sept. 23-24 for the Early User Edition of Discovery Summit, tailor-made for new users. Register now for free!
- See how to use the JMP Marketplace – Free tools to expand JMP capabilities. Register. July 10, 2 pm US Eastern Time.
- Subscribe to RSS Feed
- Mark Topic as New
- Mark Topic as Read
- Float this Topic for Current User
- Bookmark
- Subscribe
- Mute
- Printer Friendly Page
Discussions
Solve problems, and share tips and tricks with other JMP users.- JMP User Community
- :
- Discussions
- :
- Comparing DoEs- Why D/G/A/I- efficiencies are all the SAME and terribly LOW?

- Mark as New
- Bookmark
- Subscribe
- Mute
- Subscribe to RSS Feed
- Get Direct Link
- Report Inappropriate Content
Comparing DoEs- Why D/G/A/I- efficiencies are all the SAME and terribly LOW?
Hi,
I am working on Custom DoE (JMP16). I have 4 factors (1 continuous and 3 discrete num, with constraints). I have 1 response. I know these 4 factors are important and have interactions. My goal is to optimize the response to find the optimal factor levels that result in the highest efficiency possible. I included all quadratic and interaction effects.
I am using the I-optimality since this is not a screening design.
- The first design (v5) has no replicates. It has 18 runs total.
- The second design (v6) has duplicates. It has a total of 36 runs (I augmented it).
- The third design (v7) has triplicates. It has a total of 54 runs (I augmented it).
For this experiment that I plan to do, it is easier for me to add duplicates or triplicates (of the same conditions) once in the lab. That's why I don't mind if I have more runs, as long as these are of the same conditions (duplicates or triplicates), because I am able to run them all together as long as these are replicates of the same initial 18 runs.
[If instead I was to simply use the "add replicate runs" feature, then JMP adds way too many more runs with too many different conditions for me to test (resources limitation). For example, when adding just 4 replicate runs, JMP generates a design with a default total of runs =27, which is too many different conditions to test...That's why I decided to replicate my entire design instead using the augment feature.]
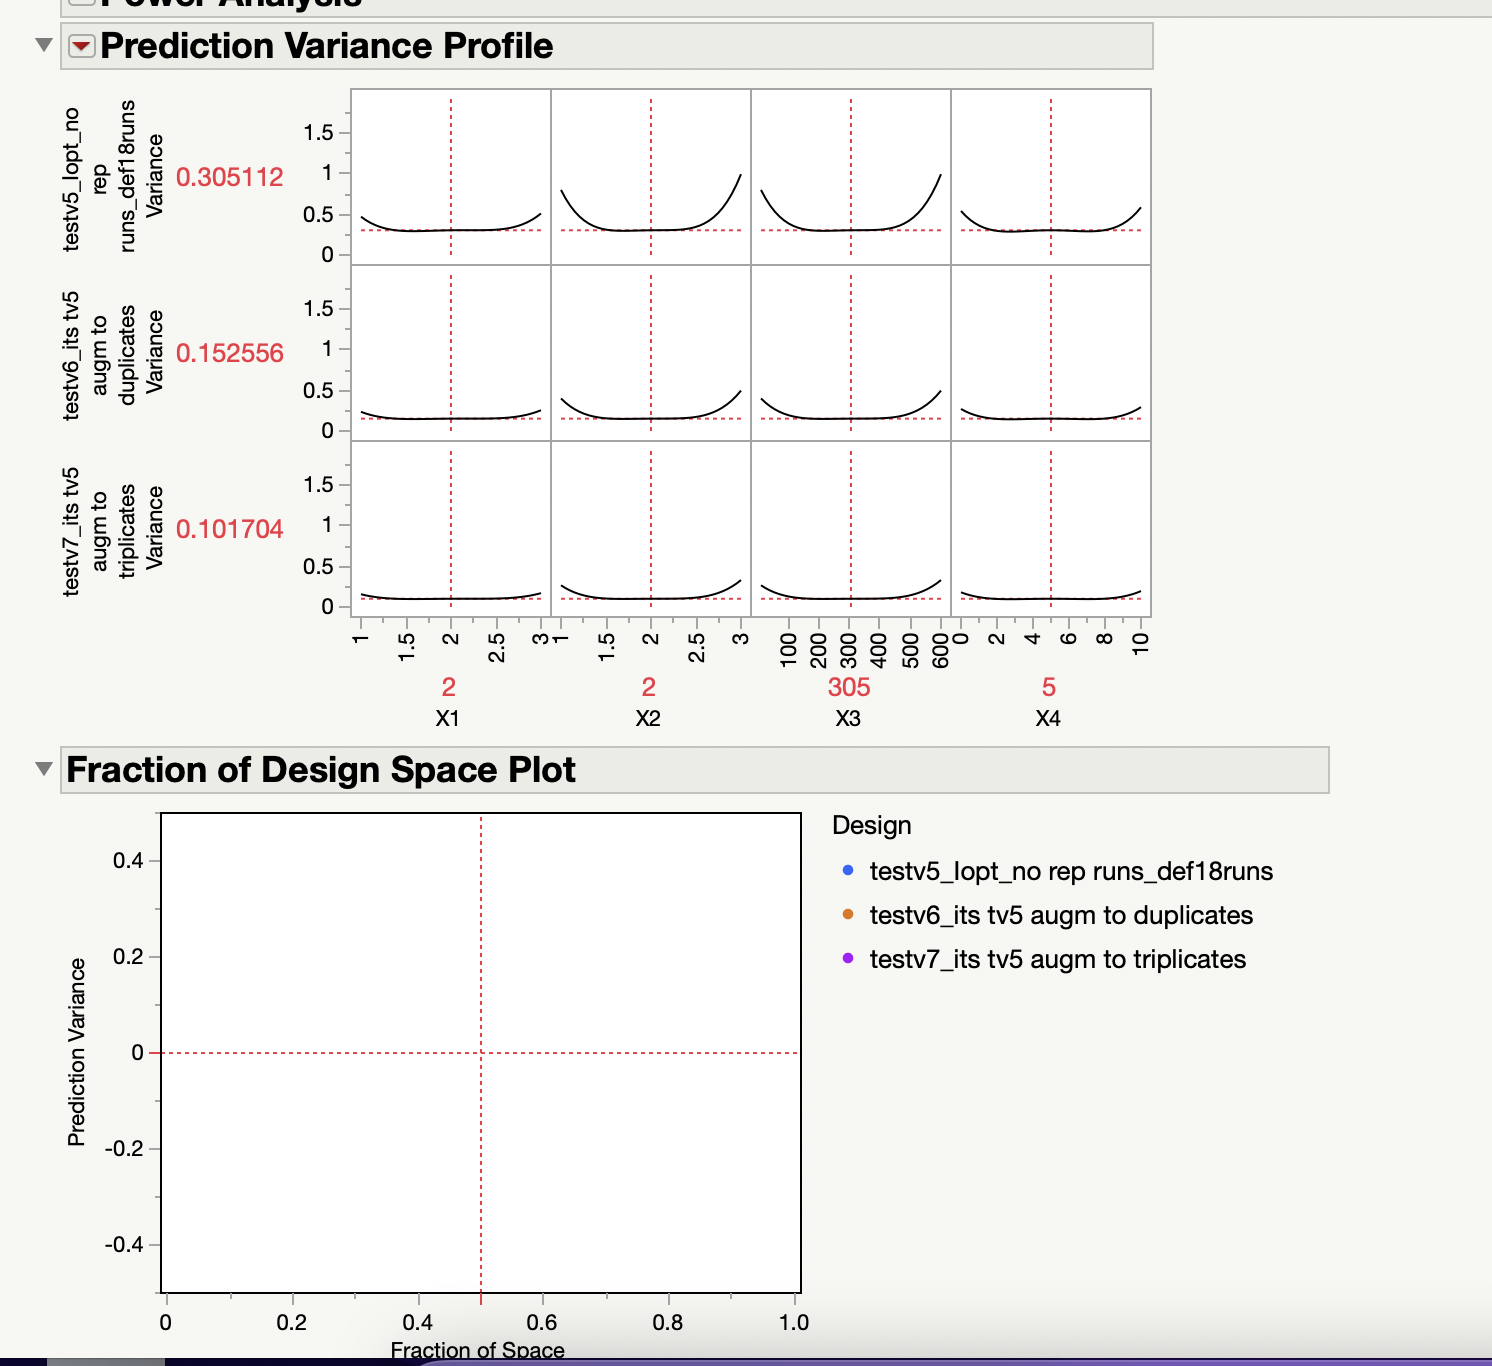
- I am comparing designs v5, v6 and v7 (attached). However, my "Fraction of Design Space" plot is blank. Why is it blank? or is the data very small that I can't see it?
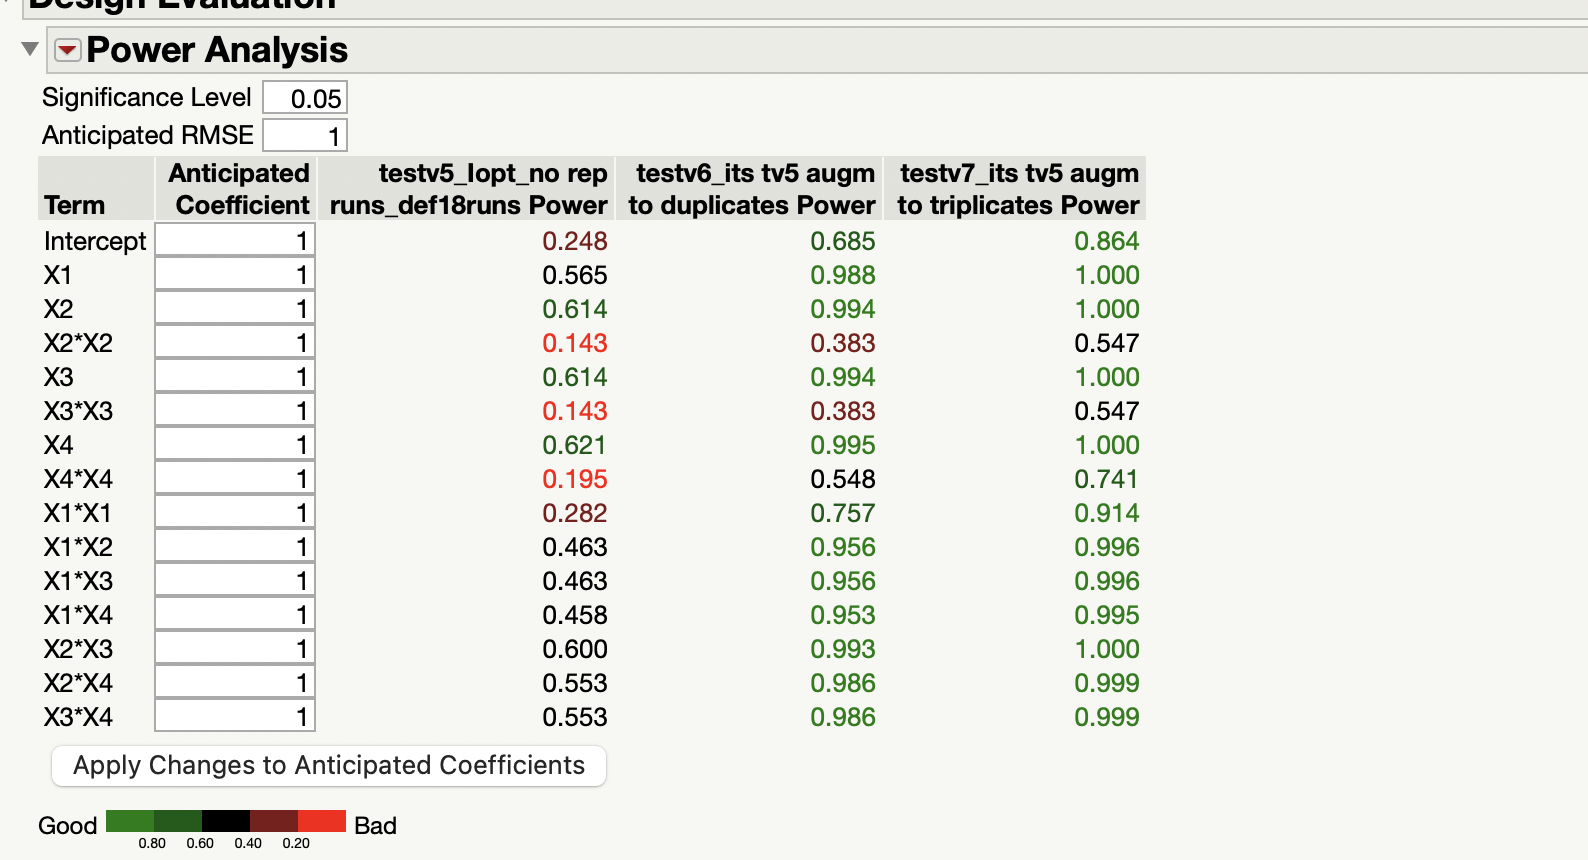
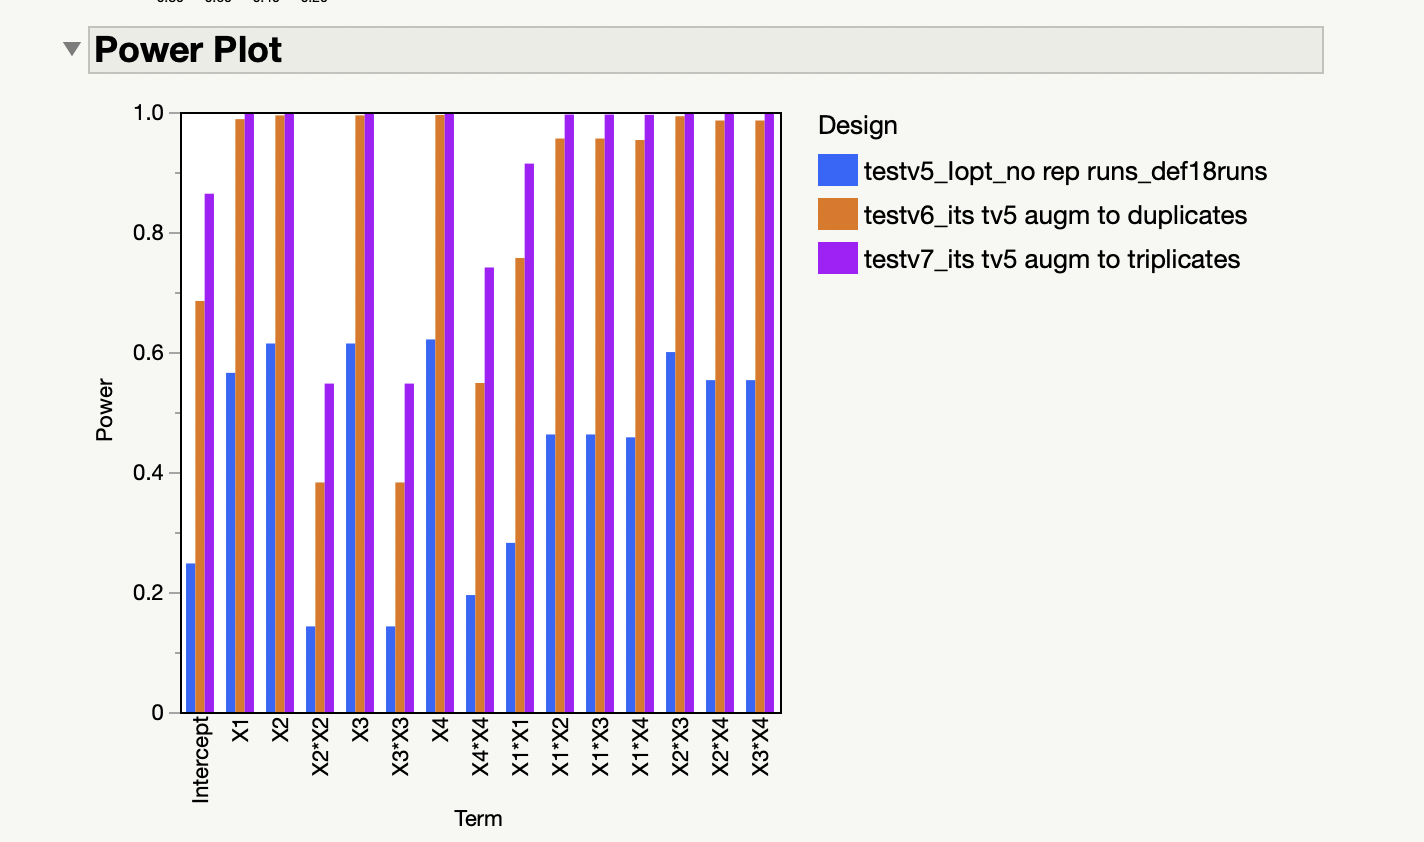
- The "Power Analysis" and "Power Plot" look pretty good for v6 and v7. But, I am interested in optimizing the response anyway (not in the main effects).
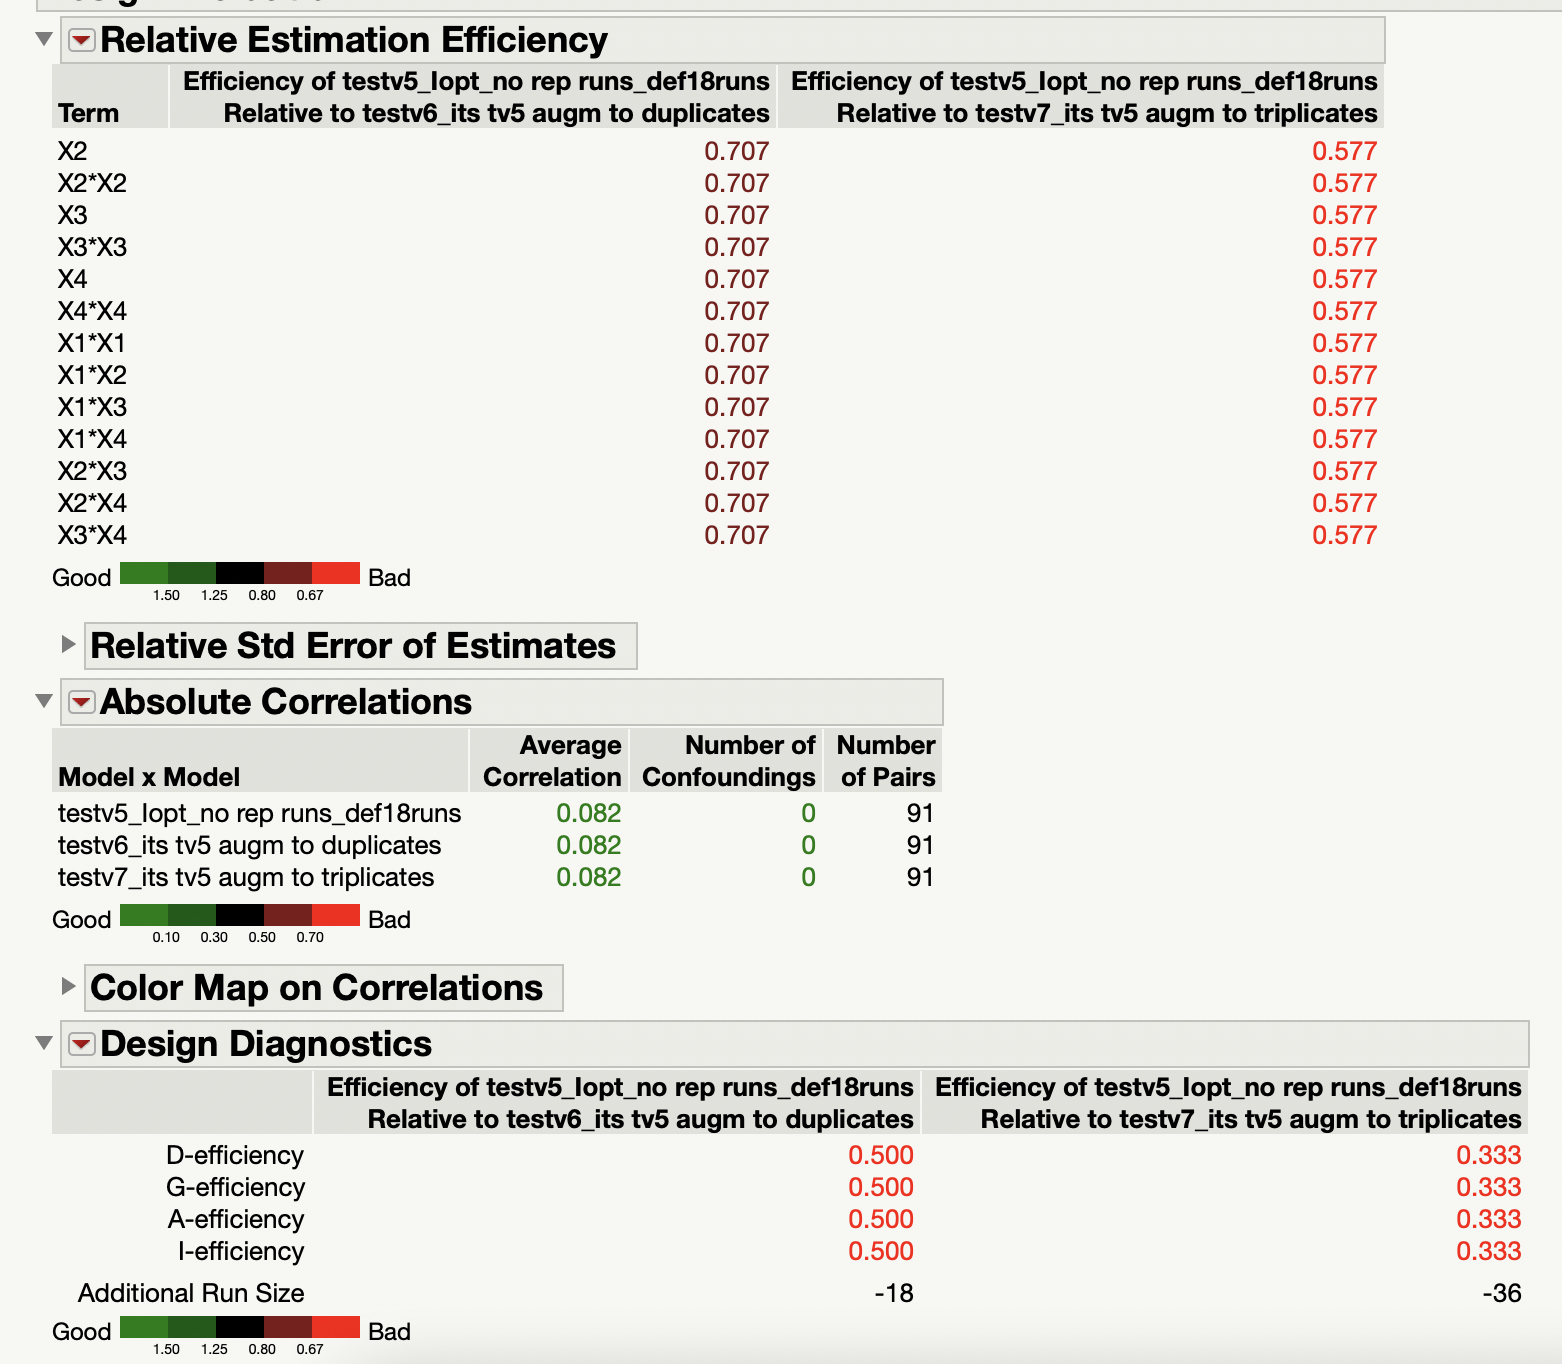
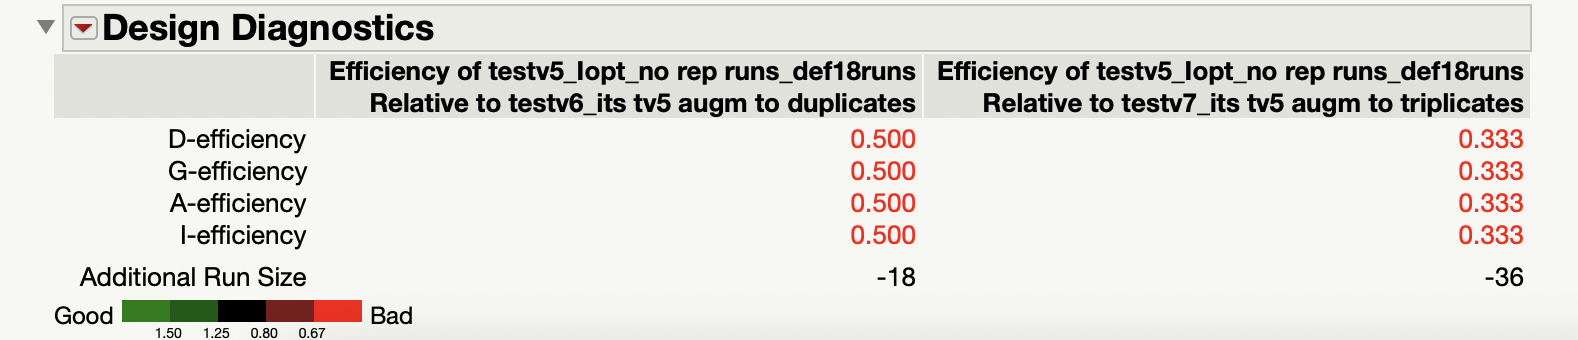
- However, the D/G/A/I- efficiencies are terribly POOR and all are the SAME. Are these all the same because design v6 is a duplicate of design v5, and design v7 is a triplicate of design v5? and why are these values so LOW (0.5 and 0.3)? Are my designs bad?
I tried to look this up but, all I found on the DOE guide is:
"Relative efficiency values that exceed 1 indicate that the reference design is preferable for the given measure. Values less than 1 indicate that the design being compared to the reference design is preferable. The 16-run design has lower efficiency than the other two designs across all metrics, indicating that the larger designs are preferable."
But, this didn't help me much.
Thank you in advance!!
- Tags:
- macOS

- Mark as New
- Bookmark
- Subscribe
- Mute
- Subscribe to RSS Feed
- Get Direct Link
- Report Inappropriate Content
Re: Comparing DoEs- Why D/G/A/I- efficiencies are all the SAME and terribly LOW?
You're welcome ! I'm happy to read that you feel comfortable with this design and that you'll try it in the lab.
Please send some news about how it did, and if you have any problems or questions, the JMP Community is here ! :)
Have a great weekend too @ADouyon !
"It is not unusual for a well-designed experiment to analyze itself" (Box, Hunter and Hunter)

- Mark as New
- Bookmark
- Subscribe
- Mute
- Subscribe to RSS Feed
- Get Direct Link
- Report Inappropriate Content
Re: Comparing DoEs- Why D/G/A/I- efficiencies are all the SAME and terribly LOW?
The prediction variance is helpful information when comparing two or more designs when prediction is the primary goal of this experiment—the lower the variance, the better the design.
Remember that there is no information about the variance of the response before the data is collected. This plot assumes that this variance is 1, which is unlikely. The plot also assumes the linear model and its assumptions, including constant variance throughout the response range. If you have an estimate of the response, then multiply the scale in this plot by your estimate to learn the actual prediction variance. The square root of this variance is the standard error of prediction.
- Mark as New
- Bookmark
- Subscribe
- Mute
- Subscribe to RSS Feed
- Get Direct Link
- Report Inappropriate Content
Re: Comparing DoEs- Why D/G/A/I- efficiencies are all the SAME and terribly LOW?
Thank you @Mark_Bailey for the clarification!!
- « Previous
- Next »
Recommended Articles
- © 2026 JMP Statistical Discovery LLC. All Rights Reserved.
- Terms of Use
- Privacy Statement
- Contact Us