- Instantly extract effect sizes, F-ratios, and FDR-adjusted p-values from your models with the Calculate Effects Sizes extension, available now in the JMP Marketplace!
- New to JMP? Join us Sept. 23-24 for the Early User Edition of Discovery Summit, tailor-made for new users. Register now for free!
- Your voice matters! Tell us how you prefer to receive JMP updates, so we can tailor our communication to your needs. Take short survey.
- Subscribe to RSS Feed
- Mark Topic as New
- Mark Topic as Read
- Float this Topic for Current User
- Bookmark
- Subscribe
- Mute
- Printer Friendly Page
Discussions
Solve problems, and share tips and tricks with other JMP users.- JMP User Community
- :
- Discussions
- :
- Comment faire ce genre de graphique dans JMP? Le diagramme de Winchester et Floy...

- Mark as New
- Bookmark
- Subscribe
- Mute
- Subscribe to RSS Feed
- Get Direct Link
- Report Inappropriate Content
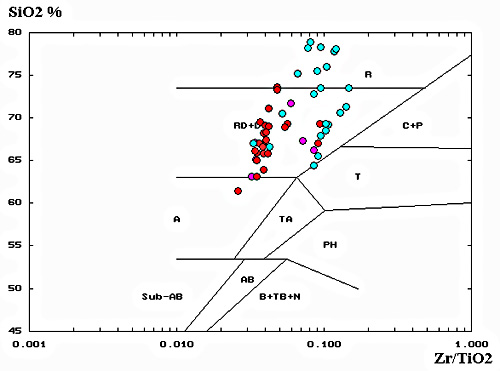
Comment faire ce genre de graphique dans JMP? Le diagramme de Winchester et Floyd (1977)


J'ai JMP 14. Et je souhaiterais savoir comment obtenir le diagramme ci-joint? J'ai réussi à faire deux graphiques avec deux tables différentes, un graphique pour les lignes et un autre pour les points. Mais je ne sais pas comment fusionner les deux graphiques en un seul. Un grand merci pour votre aide.
Mikaël
Accepted Solutions

- Mark as New
- Bookmark
- Subscribe
- Mute
- Subscribe to RSS Feed
- Get Direct Link
- Report Inappropriate Content
Re: Comment faire ce genre de graphique dans JMP? Le diagramme de Winchester et Floyd (1977)
Hi Mikaël,
I think I understand now what you are asking.
How to add multiple elements to graph using JMP Graph Builder platform?
Start by clicking the line element from the available options after dragging SiO2% to y-axis and Nb/Y ppm to the x-axis.
Select Row order under the Line element properties

Adding points ( or additional elements to existing graph )
You can do this a few different ways. After generating the line plot in graph builder you can right click the graph, select add, then select points. Alternatively, you can add the points on top of the line plot by dragging the icon with points (in the palette above the graph) on top of the graph. Dragging a visual (rather than clicking it) adds the visualization to the current plot (rather than replacing it).

I hope this helps,
Stan
- Mark as New
- Bookmark
- Subscribe
- Mute
- Subscribe to RSS Feed
- Get Direct Link
- Report Inappropriate Content
Re: Comment faire ce genre de graphique dans JMP? Le diagramme de Winchester et Floyd (1977)
@mgh35 ,
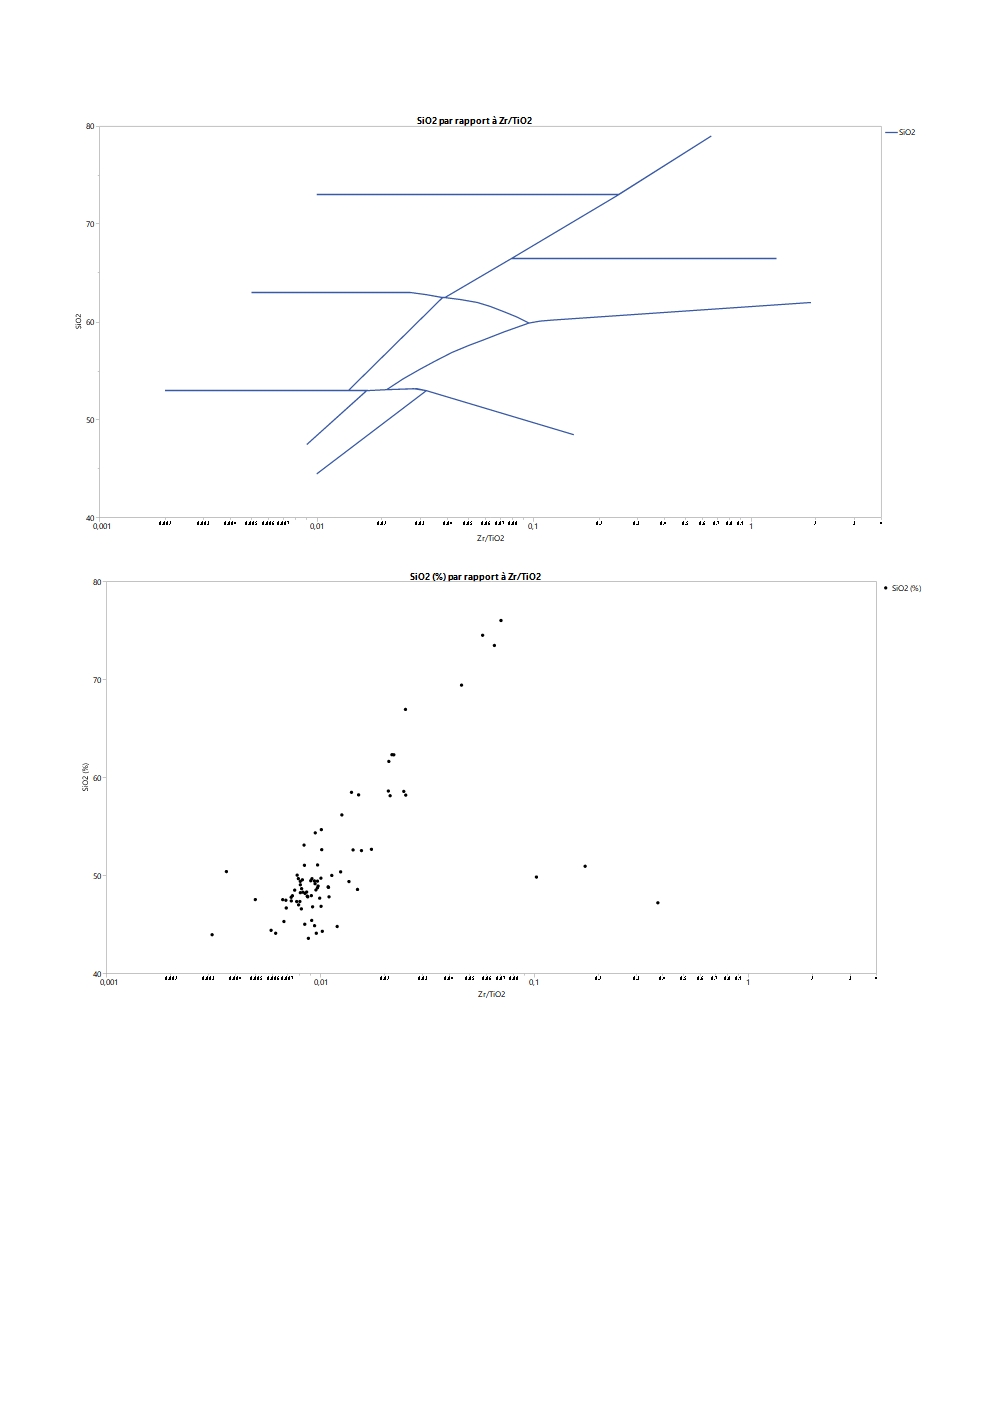
I quickly put together a data set and used the annotate option to position the labels.
Not sure if this is exactly what you wanted but might give you an idea of how to proceed.
cheers,
Stan

Graph Builder(
	Size( 1231, 879 ),
	Show Control Panel( 0 ),
	Variables( X( :"Nb/Y ppm"n ), Y( :SiO2% ) ),
	Elements(
		Line( X, Y, Legend( 5 ), Row order( 1 ), Summary Statistic( "N" ) ),
		Points( X, Y, Legend( 7 ) )
	),
	SendToReport(
		Dispatch(
			{},
			"Nb/Y ppm",
			ScaleBox,
			{Scale( "Log" ), Format( "Best", 12 ), Min( 0.0189841314040199 ),
			Max( 12.4117356891639 ), Inc( 1 ), Minor Ticks( 1 )}
		),
		Dispatch(
			{},
			"SiO2%",
			ScaleBox,
			{Min( 38.6575949367089 ), Max( 79.3642685467073 ), Inc( 10 ), Minor Ticks( 1 )}
		),
		Dispatch(
			{},
			"Graph Builder",
			FrameBox,
			{Add Text Annotation(
				Text( "Akali basalt" ),
				Fixed Size( 0 ),
				Text Box( {744, 593, 826, 612} ),
				Filled( 0 )
			), Add Text Annotation(
				Text( "Basanite
Nephelinite
" ),
				Fixed Size( 0 ),
				Text Box( {972, 658, 1053, 707} ),
				Filled( 0 )
			), Add Text Annotation(
				Text( "Rhyolite" ),
				Fixed Size( 0 ),
				Text Box( {459, 39, 522, 58} ),
				Filled( 0 )
			), Add Text Annotation(
				Text( "Rhyodacite
Dacite
" ),
				Fixed Size( 0 ),
				Text Box( {358, 195, 439, 244} ),
				Filled( 0 )
			), Add Text Annotation(
				Text( "Andesite" ),
				Fixed Size( 1 ),
				Text Box( {339, 384, 498, 454} ),
				Filled( 0 )
			), Add Text Annotation(
				Text( "Sub-alkaline basalt
" ),
				Fixed Size( 0 ),
				Text Box( {256, 608, 382, 642} ),
				Filled( 0 )
			), Add Text Annotation(
				Text( "Trachyandesite
" ),
				Fixed Size( 0 ),
				Text Box( {695, 471, 799, 505} ),
				Filled( 0 )
			), Add Text Annotation(
				Text( "Phonolite" ),
				Fixed Size( 0 ),
				Text Box( {1005, 461, 1075, 480} ),
				Filled( 0 )
			), Add Text Annotation(
				Text( "Trachyte" ),
				Fixed Size( 0 ),
				Text Box( {897, 285, 963, 304} ),
				Filled( 0 )
			), Add Text Annotation(
				Text( "Comendite
Pantellerite
" ),
				Fixed Size( 0 ),
				Text Box( {880, 123, 961, 172} ),
				Filled( 0 )
			)}
		),
		Dispatch( {}, "400", LegendBox, {Legend Position( {5, [-1], 7, [0]} )} )
	)
)
- Mark as New
- Bookmark
- Subscribe
- Mute
- Subscribe to RSS Feed
- Get Direct Link
- Report Inappropriate Content
Re: Comment faire ce genre de graphique dans JMP? Le diagramme de Winchester et Floyd (1977)
Bonjour Stan, Merci pour le script. J'avais réussi à faire ce genre de graphique avec le constructeur de graphique. Mais je ne sais pas comment rajouter des points (par exemple des points rouges et bleus comme dans le graphique transmis précédemment). Est-ce que c'est possible à partir de deux tables de données ou d'une seule table de données pour générer ce type de graphique.
Merci beaucoup, bonne journée.
Mikaël (JMP14, débutant)

- Mark as New
- Bookmark
- Subscribe
- Mute
- Subscribe to RSS Feed
- Get Direct Link
- Report Inappropriate Content
Re: Comment faire ce genre de graphique dans JMP? Le diagramme de Winchester et Floyd (1977)
Just an idea.
Does it make sense to use a custom map for these data?
Benutzerdefinierte Karten für nicht-geografische Daten
- Mark as New
- Bookmark
- Subscribe
- Mute
- Subscribe to RSS Feed
- Get Direct Link
- Report Inappropriate Content
Re: Comment faire ce genre de graphique dans JMP? Le diagramme de Winchester et Floyd (1977)
Hi Mikaël,
I think I understand now what you are asking.
How to add multiple elements to graph using JMP Graph Builder platform?
Start by clicking the line element from the available options after dragging SiO2% to y-axis and Nb/Y ppm to the x-axis.
Select Row order under the Line element properties
Adding points ( or additional elements to existing graph )
You can do this a few different ways. After generating the line plot in graph builder you can right click the graph, select add, then select points. Alternatively, you can add the points on top of the line plot by dragging the icon with points (in the palette above the graph) on top of the graph. Dragging a visual (rather than clicking it) adds the visualization to the current plot (rather than replacing it).
I hope this helps,
Stan
- Mark as New
- Bookmark
- Subscribe
- Mute
- Subscribe to RSS Feed
- Get Direct Link
- Report Inappropriate Content
Re: Comment faire ce genre de graphique dans JMP? Le diagramme de Winchester et Floyd (1977)
Merci beaucoup, c'est parfait!
Mikaël
Recommended Articles
- © 2026 JMP Statistical Discovery LLC. All Rights Reserved.
- Terms of Use
- Privacy Statement
- Contact Us