- Learn how to build custom Python data connectors and further customize JMP’s Data Connector Framework with the Python Data Connector Demo, available now in the JMP Marketplace!
- See how to use Accelerated Life Testing (ALT) to evaluate reliability. Register for June 5 webinar, 2pm US Eastern Time.
- Subscribe to RSS Feed
- Mark Topic as New
- Mark Topic as Read
- Float this Topic for Current User
- Bookmark
- Subscribe
- Mute
- Printer Friendly Page
Discussions
Solve problems, and share tips and tricks with other JMP users.- JMP User Community
- :
- Discussions
- :
- Re: Clustered bar chart by variable

- Mark as New
- Bookmark
- Subscribe
- Mute
- Subscribe to RSS Feed
- Get Direct Link
- Report Inappropriate Content
Clustered bar chart by variable
Hi all,
This might sound like a simple question but I haven't figured out a way to make this work.
I ran a test on multiple samples and for each sample, the test outputs the percentages of the three different components that make up the sample.
I set up a data table with 4 columns: 1 for sample name and the other 3 for the percentages of the 3 components.
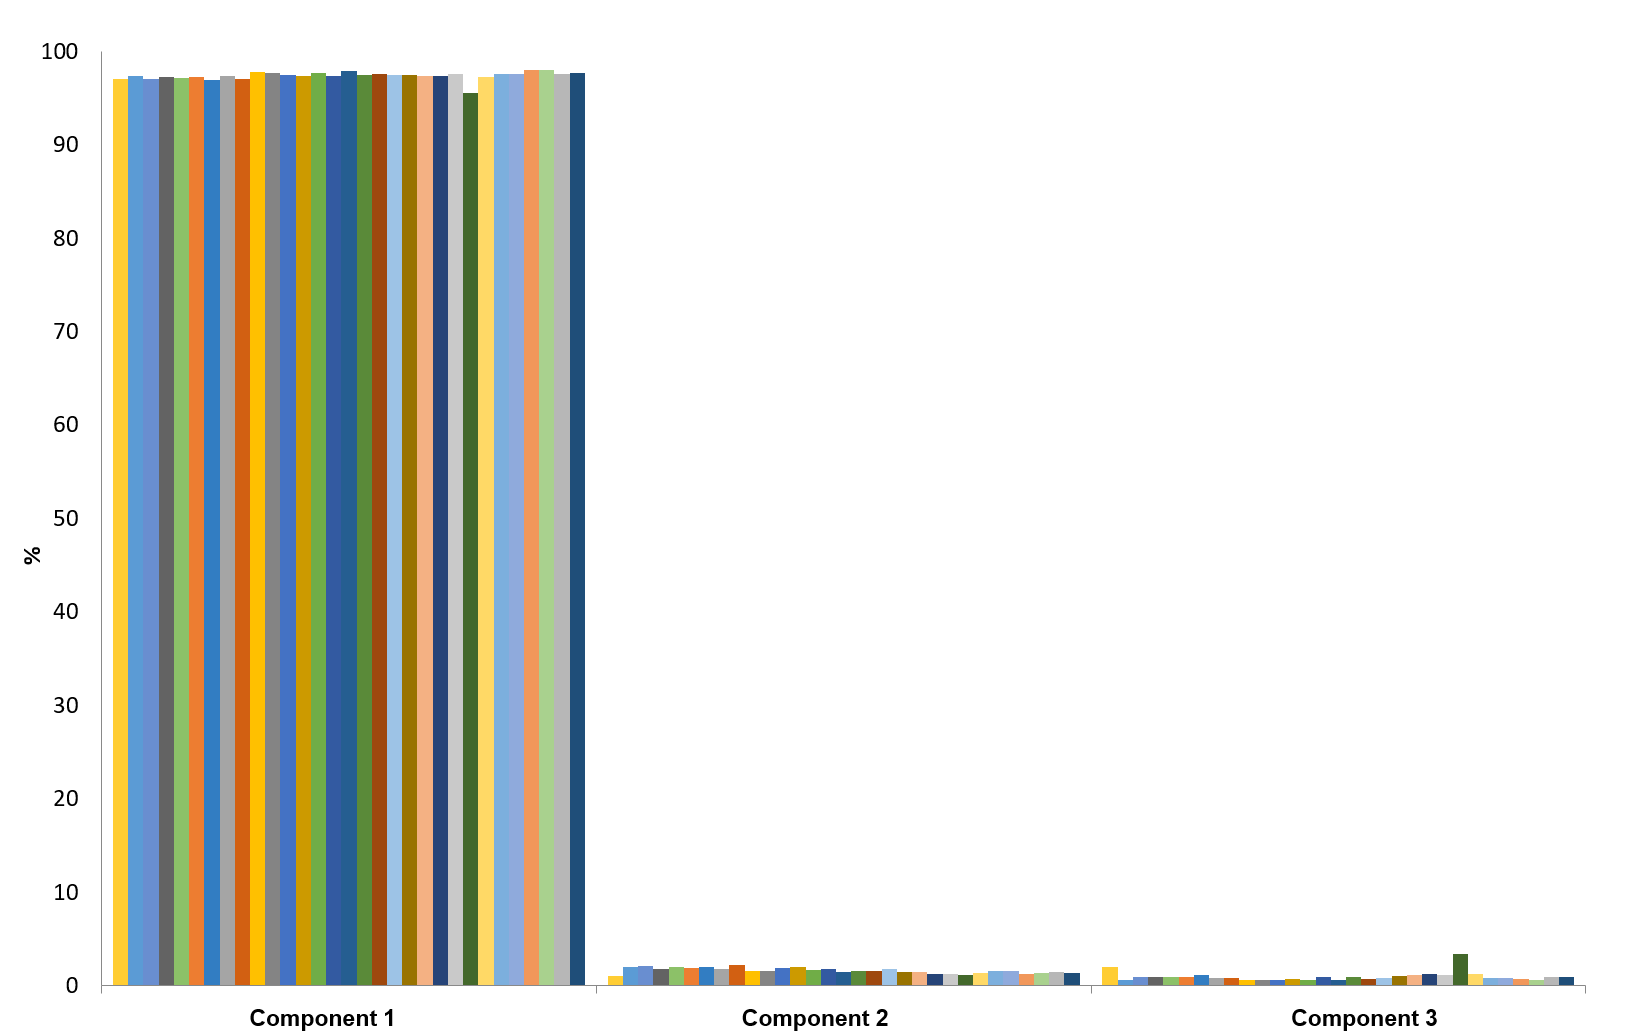
I'm trying to create a clustered bar chart as shown in the attached picture (done in Excel), where the data are grouped into 3 different clusters, corresponding to the 3 components.
I know that I could try stacking all the component columns first ("Clustering by Variable" described here); however that would make it into a super long table and hard to navigate (I have multiple types of tests, each outputting different components). Also, I would need to have 2 separate tables, one for the original data format which is easier to navigate and another for the clustered bar charts.
I'm thinking of two different methods to get around this.
1) For each test, plot the results for each component side by side. Is there a way to have them all share the same y-axis?
2) Using the column stacking method, is there any way I can combine the two tables into one so that I could have a saved script in the original table that would generate the clustered bar charts automatically as I click it? I'm aware that I could save the script that generates the stacked table but then I would still need to re-make the clustered bar charts.
Thank you!
Accepted Solutions

- Mark as New
- Bookmark
- Subscribe
- Mute
- Subscribe to RSS Feed
- Get Direct Link
- Report Inappropriate Content
Re: Clustered bar chart by variable
I was able to reproduce your graph with a simple Stack and then a Graph Builder.

Names default to here(1);
dt = New Table( "Example",
	Add Rows( 5 ),
	New Column( "Sample",
		Character,
		"Nominal",
		Set Values( {"A", "B", "C", "D", "E"} )
	),
	New Column( "Component 1",
		Numeric,
		"Continuous",
		Format( "Percent", 7, 2 ),
		Set Selected,
		Set Values(
			[0.828470097854734, 0.8212191631319, 0.842324016243219,
			0.882067339960486, 0.872661964339204]
		)
	),
	New Column( "Component 2",
		Numeric,
		"Continuous",
		Format( "Percent", 7, 2 ),
		Set Selected,
		Set Values(
			[0.116772082395202, 0.140967620703167, 0.125925316195233,
			0.0770373142695993, 0.113037678561007]
		)
	),
	New Column( "Component 3",
		Numeric,
		"Continuous",
		Format( "Percent", 7, 2 ),
		Set Selected,
		Set Values(
			[0.0547578197500645, 0.0378132161649326, 0.0317506675615479,
			0.0408953457699151, 0.0143003570997886]
		)
	)
);
dtStack = dt << Stack(
	columns( :Component 1, :Component 2, :Component 3 ),
	Source Label Column( "Label" ),
	Stacked Data Column( "Data" )
);

dtStack << Graph Builder(
	Size( 534, 454 ),
	Show Control Panel( 0 ),
	Variables(
		X( :Label ),
		X( :Sample, Position( 1 ) ),
		Y( :Data ),
		Overlay( :Sample )
	),
	Elements( Bar( X( 1 ), X( 2 ), Y, Legend( 33 ) ) ),
	SendToReport(
		Dispatch(
			{},
			"Label",
			ScaleBox,
			{Label Row( 1, {Automatic Tick Marks( 0 ), Show Major Labels( 0 )} )}
		),
		Dispatch(
			{},
			"Graph Builder",
			FrameBox,
			{DispatchSeg( BarSeg( 1 ), Set Width Proportion( 1 ) )}
		)
	)
);
- Mark as New
- Bookmark
- Subscribe
- Mute
- Subscribe to RSS Feed
- Get Direct Link
- Report Inappropriate Content
Re: Clustered bar chart by variable
I was able to reproduce your graph with a simple Stack and then a Graph Builder.
Names default to here(1);
dt = New Table( "Example",
	Add Rows( 5 ),
	New Column( "Sample",
		Character,
		"Nominal",
		Set Values( {"A", "B", "C", "D", "E"} )
	),
	New Column( "Component 1",
		Numeric,
		"Continuous",
		Format( "Percent", 7, 2 ),
		Set Selected,
		Set Values(
			[0.828470097854734, 0.8212191631319, 0.842324016243219,
			0.882067339960486, 0.872661964339204]
		)
	),
	New Column( "Component 2",
		Numeric,
		"Continuous",
		Format( "Percent", 7, 2 ),
		Set Selected,
		Set Values(
			[0.116772082395202, 0.140967620703167, 0.125925316195233,
			0.0770373142695993, 0.113037678561007]
		)
	),
	New Column( "Component 3",
		Numeric,
		"Continuous",
		Format( "Percent", 7, 2 ),
		Set Selected,
		Set Values(
			[0.0547578197500645, 0.0378132161649326, 0.0317506675615479,
			0.0408953457699151, 0.0143003570997886]
		)
	)
);
dtStack = dt << Stack(
	columns( :Component 1, :Component 2, :Component 3 ),
	Source Label Column( "Label" ),
	Stacked Data Column( "Data" )
);

dtStack << Graph Builder(
	Size( 534, 454 ),
	Show Control Panel( 0 ),
	Variables(
		X( :Label ),
		X( :Sample, Position( 1 ) ),
		Y( :Data ),
		Overlay( :Sample )
	),
	Elements( Bar( X( 1 ), X( 2 ), Y, Legend( 33 ) ) ),
	SendToReport(
		Dispatch(
			{},
			"Label",
			ScaleBox,
			{Label Row( 1, {Automatic Tick Marks( 0 ), Show Major Labels( 0 )} )}
		),
		Dispatch(
			{},
			"Graph Builder",
			FrameBox,
			{DispatchSeg( BarSeg( 1 ), Set Width Proportion( 1 ) )}
		)
	)
);
- Mark as New
- Bookmark
- Subscribe
- Mute
- Subscribe to RSS Feed
- Get Direct Link
- Report Inappropriate Content
Re: Clustered bar chart by variable
Thank you!
I've never done scripting in JMP but I was able to merge the stack script from original table and graph builder script from the stacked table into one with a little modification and got it to work. A new table still needs to be generated but at least I'll only have one table to keep.
Sounds like I'll need to start learning to script in JMP to make my life easier.
Out of curiosity, is there any function in JMP that allows me to "record" what I do on the user interface into script?
- Mark as New
- Bookmark
- Subscribe
- Mute
- Subscribe to RSS Feed
- Get Direct Link
- Report Inappropriate Content
Re: Clustered bar chart by variable
The answer is yes.
The JSL I posted was mostly written by JMP. Every Platform that you run, and each of the File==>Tables operation that you do, will surface the JSL that will regenerate the data tables or displays that were interactively created.
When you create a new data table by stacking, the "Source" entry for the new table contains the JSL that will create the data table.
For the Graph Builder Platform, if you go to the red triangle and select "Save Script" it will provide a script that will recreate the graph.
- Mark as New
- Bookmark
- Subscribe
- Mute
- Subscribe to RSS Feed
- Get Direct Link
- Report Inappropriate Content
Re: Clustered bar chart by variable
I got what you're saying and that was exactly what I did - combining the table stacking script and the Graph Builder script.
I was just asking for the cases where I need to do multiple operations (say, generate multiple graphs in the second table) rather than just two - whether there is a way to "record" all of those operations into a single script as I perform them. Not saying that it's necessary, I'm just wondering if such a feature exists in JMP.
- Mark as New
- Bookmark
- Subscribe
- Mute
- Subscribe to RSS Feed
- Get Direct Link
- Report Inappropriate Content
Re: Clustered bar chart by variable
The JMP method is to simply take the scripts from each of the graphs, along with the data manipulations and place them into a single script.
It sound a bit like you are thinking along the lines of saving the scripts to the data table. That is not what I am indicating. I am taking about saving the table manipulation scripts and Platform Save Scripts to a new script window.
- Mark as New
- Bookmark
- Subscribe
- Mute
- Subscribe to RSS Feed
- Get Direct Link
- Report Inappropriate Content
Re: Clustered bar chart by variable
Yeah, sounds like I misinterpreted what you meant.
Can you expand more on the "table manipulation scripts and Platform Save Scripts" bit?
One thing I've just found out is that I could actually copy the entire script of the data table. So this alone should be sufficient for what I currently need. I still need to first save individual reports to the Data Table as new scripts but now I can copy all of them at the same time rather than individually.
- Mark as New
- Bookmark
- Subscribe
- Mute
- Subscribe to RSS Feed
- Get Direct Link
- Report Inappropriate Content
Re: Clustered bar chart by variable
Let me go through what I did to produce the script that I supplied to you on this discussion, as a way to illustrate my way of creating a script.
- You did not supply a data table, so I had to create my own example data table.
- Since I wanted to supply to you my copy of my example data table, I had to decide if it was best to save and up load the table, or to just include it in the script. Since it is a very modest in size, I decided to just put in the script.
- So I opened a script window.
- I manually typed in
This normally should be the first statement of every script. It ensures that the JSL variables in this script, will be isolated to this script and not interfering with other scripts.Names Default to Here(1); - I then went to the data table I had created, and clicked on the red triangle in the table panel and selected "Copy Table Script". That placed the script that will generate the table as it currently exists, into the paste buffer.
- I then went back to the script window and pasted it into the script just below the first line
I also added dt = in front of the table definition, which allows for referencing this data table by "dt" rather than having a more formal reference of "data table("example")".Names Default to Here(1);
dt = New Table( "Example", Add Rows( 5 ), New Column( "Sample", Character, "Nominal", Set Values( {"A", "B", "C", "D", "E"} ) ), New Column( "Component 1", Numeric, "Continuous", Format( "Percent", 7, 2 ), Set Selected, Set Values( [0.828470097854734, 0.8212191631319, 0.842324016243219, 0.882067339960486, 0.872661964339204] ) ), New Column( "Component 2", Numeric, "Continuous", Format( "Percent", 7, 2 ), Set Selected, Set Values( [0.116772082395202, 0.140967620703167, 0.125925316195233, 0.0770373142695993, 0.113037678561007] ) ), New Column( "Component 3", Numeric, "Continuous", Format( "Percent", 7, 2 ), Set Selected, Set Values( [0.0547578197500645, 0.0378132161649326, 0.0317506675615479, 0.0408953457699151, 0.0143003570997886] ) ) ); - I then started playing, interactively with the data table, and graph builder, to figure out what I had to do to produce the graph I wanted. This was an iterative methodology, requiring multiple data table manipulations and graph builder executions until I got the results I wanted.
- So once I was happy with the results, I then looked as what it took to generate the results. It was a simple table manipulation of stacking the data, and then a graph builder run on the stacked data.
- First I needed to get the script code. This code is readily available in the table panel of the stacked data table. If you right click on the green triangle in front of the "source" entry in the table panel, you can select "Edit". This will display the JSL that can be used to recreate this data table. I selected all of the code and copied into the paste buffer, just after the already existing JSL in the script window
Note that I also added a pointer to the stack "dtStack =" and replaced the long reference to the original data table with the short reference of ""dt";Names default to here(1); dt = New Table( "Example", Add Rows( 5 ), New Column( "Sample", Character, "Nominal", Set Values( {"A", "B", "C", "D", "E"} ) ), New Column( "Component 1", Numeric, "Continuous", Format( "Percent", 7, 2 ), Set Selected, Set Values( [0.828470097854734, 0.8212191631319, 0.842324016243219, 0.882067339960486, 0.872661964339204] ) ), New Column( "Component 2", Numeric, "Continuous", Format( "Percent", 7, 2 ), Set Selected, Set Values( [0.116772082395202, 0.140967620703167, 0.125925316195233, 0.0770373142695993, 0.113037678561007] ) ), New Column( "Component 3", Numeric, "Continuous", Format( "Percent", 7, 2 ), Set Selected, Set Values( [0.0547578197500645, 0.0378132161649326, 0.0317506675615479, 0.0408953457699151, 0.0143003570997886] ) ) ); dtStack = dt << Stack( columns( :Component 1, :Component 2, :Component 3 ), Source Label Column( "Label" ), Stacked Data Column( "Data" ) ); - Next I went to the Graph Builder output and clicked on the red triangle and selected "Save Script==>To Clipboard"
- I then pasted the Clipboard(paste buffer) into the script.
Note, I added "dtStack <<" in front the Graph Builder statement. This is the best way to ensure that Graph Builder will run on the stacked data an not the original code.Names default to here(1); dt = New Table( "Example", Add Rows( 5 ), New Column( "Sample", Character, "Nominal", Set Values( {"A", "B", "C", "D", "E"} ) ), New Column( "Component 1", Numeric, "Continuous", Format( "Percent", 7, 2 ), Set Selected, Set Values( [0.828470097854734, 0.8212191631319, 0.842324016243219, 0.882067339960486, 0.872661964339204] ) ), New Column( "Component 2", Numeric, "Continuous", Format( "Percent", 7, 2 ), Set Selected, Set Values( [0.116772082395202, 0.140967620703167, 0.125925316195233, 0.0770373142695993, 0.113037678561007] ) ), New Column( "Component 3", Numeric, "Continuous", Format( "Percent", 7, 2 ), Set Selected, Set Values( [0.0547578197500645, 0.0378132161649326, 0.0317506675615479, 0.0408953457699151, 0.0143003570997886] ) ) ); dtStack = dt << Stack( columns( :Component 1, :Component 2, :Component 3 ), Source Label Column( "Label" ), Stacked Data Column( "Data" ) ); dtStack << Graph Builder( Size( 534, 454 ), Show Control Panel( 0 ), Variables( X( :Label ), X( :Sample, Position( 1 ) ), Y( :Data ), Overlay( :Sample ) ), Elements( Bar( X( 1 ), X( 2 ), Y, Legend( 33 ) ) ), SendToReport( Dispatch( {}, "Label", ScaleBox, {Label Row( 1, {Automatic Tick Marks( 0 ), Show Major Labels( 0 )} )} ), Dispatch( {}, "Graph Builder", FrameBox, {DispatchSeg( BarSeg( 1 ), Set Width Proportion( 1 ) )} ) ) );
So this is the process used to create a combined script. As I am sure you can envision, many different Platforms can be added to such a script, with them using the original data table("dt") or the stacked data table("dtStack") can be used. You also may have other data table manipulations you need to add, etc.
Concerning the copying in mass, scripts you have saved to a data table, I am not aware of being able to do that, however, I have not had an issue with that myself. Most of the time, I am looking to build a script, not to do my own data analysis.
- Mark as New
- Bookmark
- Subscribe
- Mute
- Subscribe to RSS Feed
- Get Direct Link
- Report Inappropriate Content
Re: Clustered bar chart by variable
Jim,
Thanks for walking me through your code - makes things very clear now. Quick question - if I want to add multiple operations to the new stacked table, I'll still need to call it out before every operation right? Say, if I also want to plot a histogram from the stacked table, I'll just add this following line?
dtStack << Distribution( Continuous Distribution( Column( :Data ) ) );

- Mark as New
- Bookmark
- Subscribe
- Mute
- Subscribe to RSS Feed
- Get Direct Link
- Report Inappropriate Content
Re: Clustered bar chart by variable
To be clear, there is not a way to record all of your operations in JMP into a single script. You can record a macro this way in Excel but not in JMP.
Instead the JSL for every platform that you run in JMP can be accessed by clicking the little red triangle and selecting one of the Save Script options.
Recommended Articles
- © 2026 JMP Statistical Discovery LLC. All Rights Reserved.
- Terms of Use
- Privacy Statement
- Contact Us