Turn on suggestions
Auto-suggest helps you quickly narrow down your search results by suggesting possible matches as you type.
- New to JMP? Join us Sept. 23-24 for the Early User Edition of Discovery Summit, tailor-made for new users. Register now for free!
- Your voice matters! Tell us how you prefer to receive JMP updates, so we can tailor our communication to your needs. Take short survey.
- See how to access JMP Marketplace - and - find, create & share add-ins to extend your JMP. Watch video.
Options
- Subscribe to RSS Feed
- Mark Topic as New
- Mark Topic as Read
- Float this Topic for Current User
- Bookmark
- Subscribe
- Mute
- Printer Friendly Page
Discussions
Solve problems, and share tips and tricks with other JMP users.- JMP User Community
- :
- Discussions
- :
- Changing colors in compare means analysis

Level I
- Mark as New
- Bookmark
- Subscribe
- Mute
- Subscribe to RSS Feed
- Get Direct Link
- Report Inappropriate Content
Changing colors in compare means analysis
Sep 23, 2024 03:12 PM
(3127 views)
Hi,
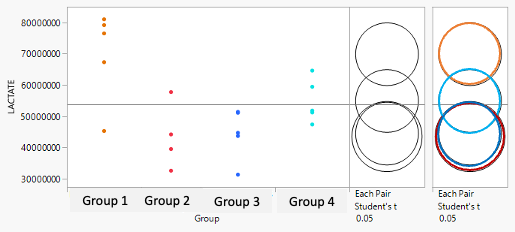
Comparing multiple groups and hitting the "compare all means."
I always find it challenging to understand which circle belongs to which group.
I tried color-coding the groups, but I still can’t get the circles to change their colors.
I know JMP is programmed to indicate statistically significant groups by marking red vs. gray, but that is not helpful to my purposes.
I copied the picture and overlayed it with colorful circles in PPTX.
Is there a way to do it directly within JMP?
While on the topic, is there a way to change the default presentation of “grand mean” + “diamond” in the ANOVA, and select a default of box plots?
Thanks,
Shahar
2 REPLIES 2

Staff
- Mark as New
- Bookmark
- Subscribe
- Mute
- Subscribe to RSS Feed
- Get Direct Link
- Report Inappropriate Content
Re: Changing colors in compare means analysis
I feel your pain on this one.
In the Rows menu you can use Color or Mark by Column and make an external legend, as well as save the colors to the column property.

HOWEVER!!, even though the color is set for the column, the rings (as well as pretty much every graphical element in the Fit Y by X platform) ignores this, so coloring of boxes, rings, diamonds etc, all has to be done manually, one at a time, for every single graph you make.
At the top of the screen, there is a "Wishlist" link. This might be a good thing to add there, if you have a few moments. (Staff can't add items to this wishlist)
JMP Systems Engineer, Health and Life Sciences (Pharma)

Super User
- Mark as New
- Bookmark
- Subscribe
- Mute
- Subscribe to RSS Feed
- Get Direct Link
- Report Inappropriate Content
Re: Changing colors in compare means analysis
Created:
Sep 25, 2024 01:01 PM
| Last Modified: Sep 25, 2024 10:03 AM
(2196 views)
| Posted in reply to message from Shahar_JMP 09-23-2024
You might have to rely on scripting. This example is not very robust, but it gives an idea
Names Default To Here(1);

dt = open("$SAMPLE_DATA/Big Class.jmp");

ow = dt << Oneway(Y(:height), X(:sex), Each Pair(1));

fb = Report(ow)[FrameBox(2)];

segs = fb << Find Segs();
segs << Class Name;

seg = fb << Find Seg(CustomStreamSeg(1));

Eval(EvalExpr(
	fb << Add Graphics Script(
		circles = Expr(seg << get script);
		colors = {"Red", "Blue"};
		For(i = 1, i <= N Items(circles), i++,
			Pen Color(colors[i]);
			Pen Size(2);
			Eval(circles[i]);
		);
	);
));

Write();
-Jarmo
Recommended Articles
- © 2026 JMP Statistical Discovery LLC. All Rights Reserved.
- Terms of Use
- Privacy Statement
- Contact Us