I have been trying to create a QQ plot using Excel which mimics the QQ plots performed by SAS JMP for normally distributed data. I am however not able to precisely mimics the confidence bands performed by SAS JMP.
I have been calculating the normal quantiles using the formulas provided in the following link:
Statistical Details for the Normal Quantile Plot (jmp.com)
The standardised residuals are then calculated by '(X - µ)/s' where µ is the mean of my data, s is the sample standard deviation.
The confidence bands are then calculated using the formulas provided by John Fox as explained in this link:
linear model - Confidence bands for QQ line - Cross Validated (stackexchange.com)
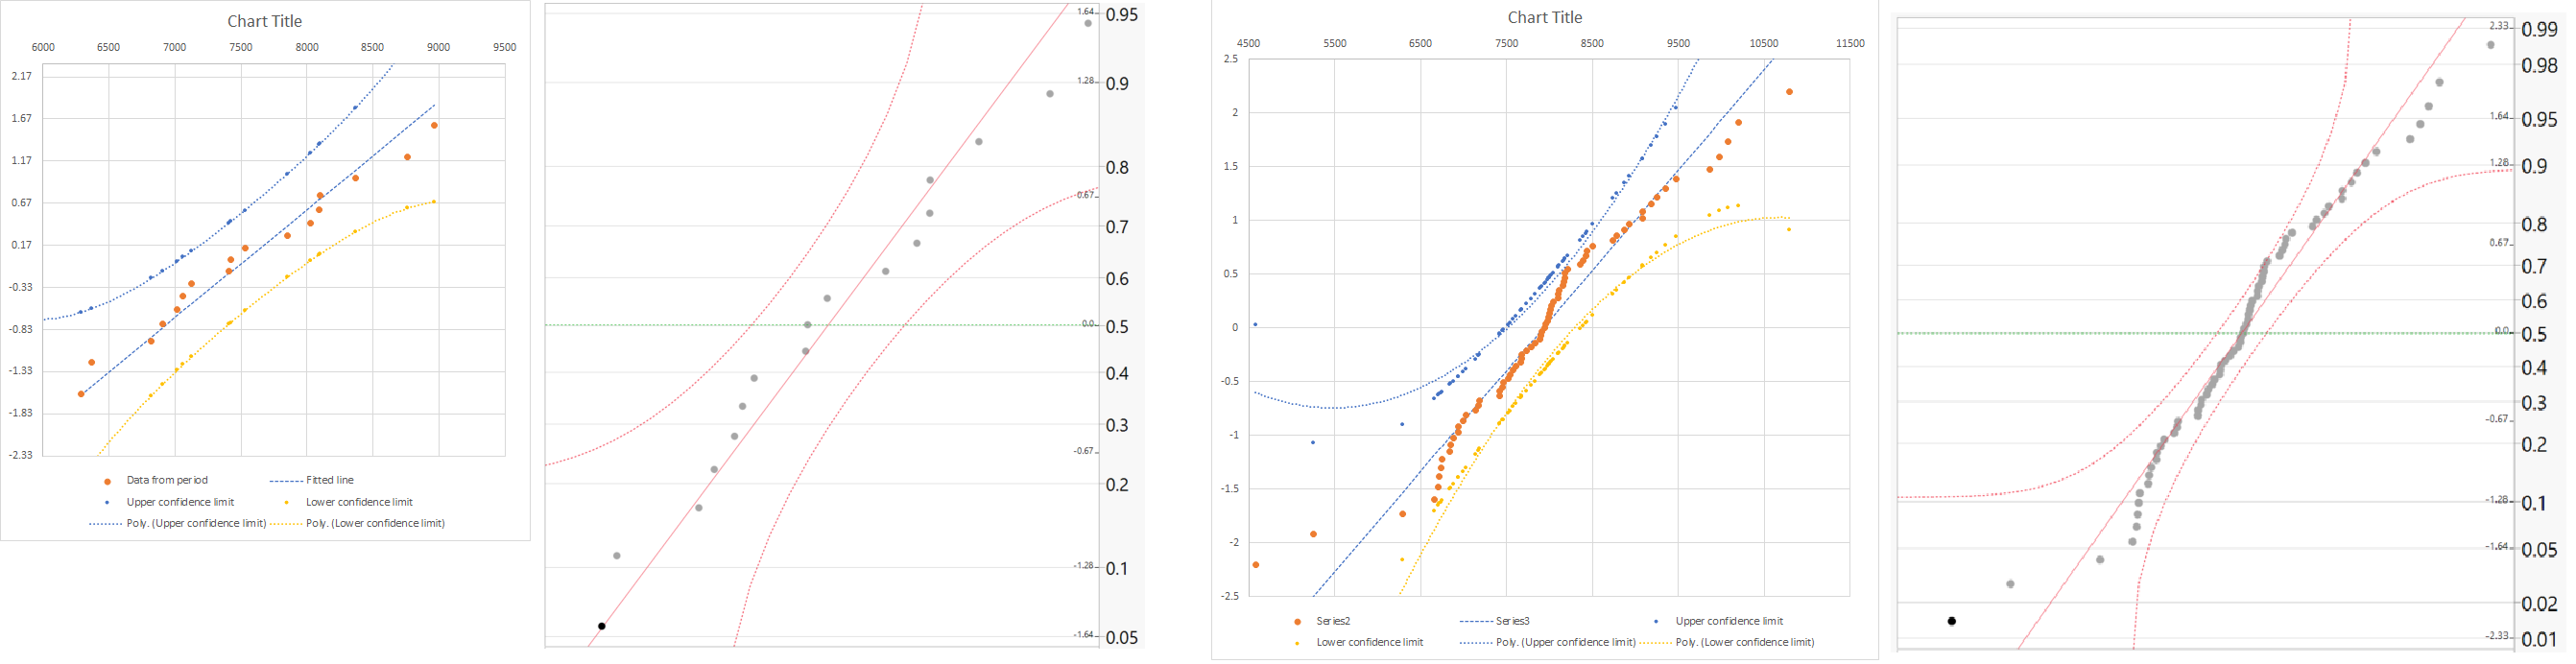
This provides me with points for the confidence bands at each data point. I then approximate the point for the confidence bands using a second order polynomial. The confidence bands that I obtain are fairly close to the ones from SAS JMP, but they start to deviate at larger data sets and especially in data sets with outliers, refer to the attached image.
I am curious if it is possible to shed some light on how the confidence bands are calculated by SAS JMP for the QQ plot? It seems to me that there is some esimation of asymptotes for the bands that is incorperated in the calculation, but I have not been able to find any information on how to perform these calculations.

