cancel
Showing results for 
Show  only  | Search instead for 
Did you mean: 
JMP is taking Discovery online, April 16 and 18. Register today and join us for interactive sessions featuring popular presentation topics, networking, and discussions with the experts.
Choose Language Hide Translation Bar
CCD
CCD
Level I

Axis in Loading plot of PCA in JMP

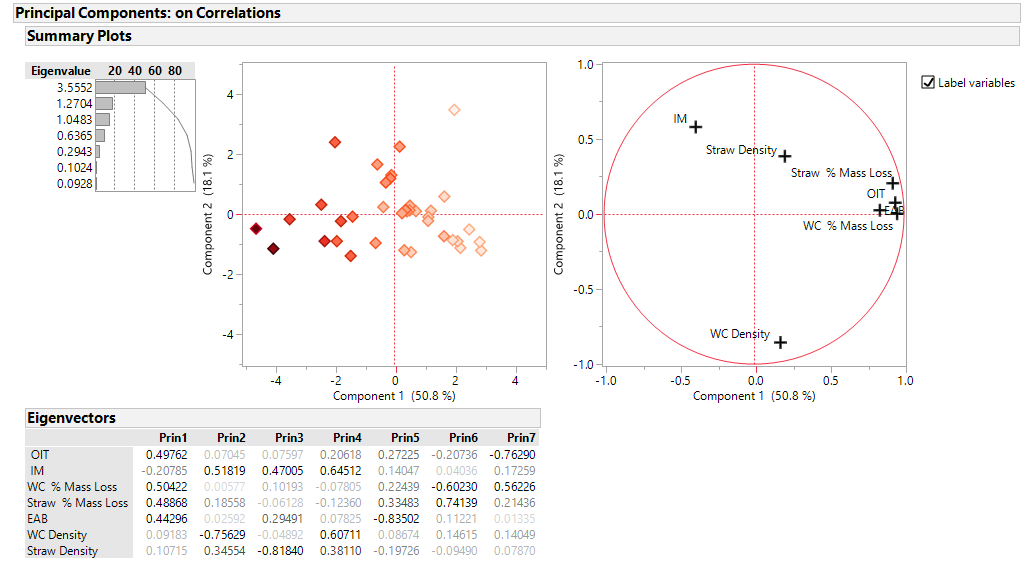
The loading plots of PCA in JMP always have axis from -1 to +1. But the eigen vectors of the linear combinations of PCs are not necessearyly goes from -1 to +1. For example the file I uploaded has highest value in PC1 in the loading plot, WC % Mass Loss is very close to +1 in the loading plot but its real eigenvector value(coefficient) is ~0.5.

Why it dosent show the variables real eigenvectors in the loading plot. 

Because I have seen other examples (from different softwares) that the loading plot axix values for each original variables are same as that of their eogenvectors.


Thanks.

1 REPLY 1

Re: Axis in Loading plot of PCA in JMP

I think the loadings plot is scaled to provide meaning on what is a "large" loading. First, realize that the scaling that is performed will depend on the matrix you used for extracting the principal components (correlation vs covariance vs none). The scaling allows one to quickly "see" which loadings are large. Those close to +/-1 are larger loadings. The pattern of the loadings plot is exactly the same as if you plotted the values from the Eigenvectors. The scaling allows better comparison of the variables as well as being necessary for the Biplot where the loadings plot and score plots are combined.


Two other points. You can see the values used to create the loadings plot by looking at the Loading Matrix from the red popup menu. If you truly want to plot the unscaled loadings, you can right-click on the Eigenvectors table and save it as a data table for you to make that plot. Most people don't need to see the actual loading values as the values are relative and the pattern is usually of most importance.

Dan Obermiller