Turn on suggestions
Auto-suggest helps you quickly narrow down your search results by suggesting possible matches as you type.
Options
- Subscribe to RSS Feed
- Mark Topic as New
- Mark Topic as Read
- Float this Topic for Current User
- Bookmark
- Subscribe
- Mute
- Printer Friendly Page
Discussions
Solve problems, and share tips and tricks with other JMP users.- JMP User Community
- :
- Discussions
- :
- Axis Setting in %
- Mark as New
- Bookmark
- Subscribe
- Mute
- Subscribe to RSS Feed
- Get Direct Link
- Report Inappropriate Content
Axis Setting in %
Created:
Nov 17, 2021 05:26 AM
| Last Modified: Jun 11, 2023 4:19 AM
(1415 views)
Hi,
Great day. I imported data from Excel, however the data in percentage auto-converted to number in decimal places.
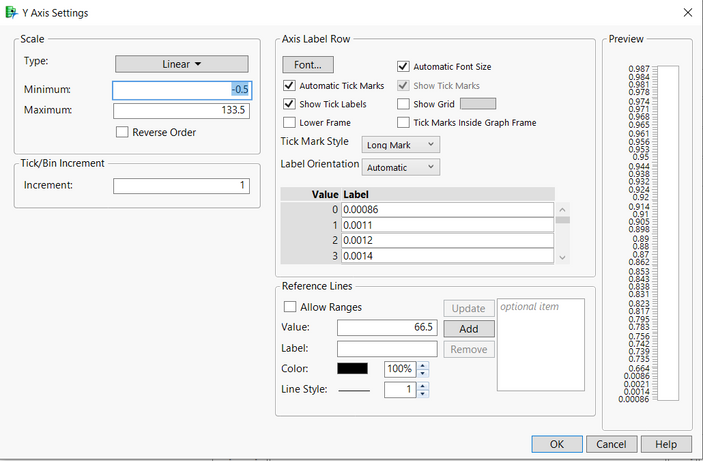
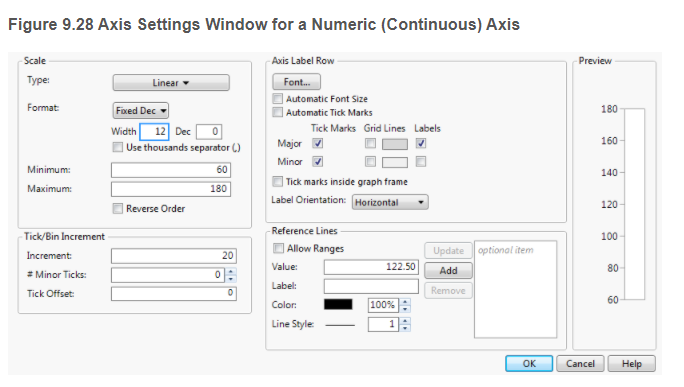
I wonder how I can present them in % in the graph. My axis setting (Fig 1) is different from what is shown in the Help page (Fig 2). How could I get there/ how to change them into better axis?
Thanks a lot!
Fig 1: Axis setting in my computer
Fig 2: Axis setting in Help Page.
Best regards,
Shin Yi
2 REPLIES 2
- Mark as New
- Bookmark
- Subscribe
- Mute
- Subscribe to RSS Feed
- Get Direct Link
- Report Inappropriate Content
Re: Axis Setting in %
If I were to make a guess, the data you have has Character data type or Ordinal / Nominal modeling type and it should be most likely Numeric Continuous.
-Jarmo
- Mark as New
- Bookmark
- Subscribe
- Mute
- Subscribe to RSS Feed
- Get Direct Link
- Report Inappropriate Content
Re: Axis Setting in %
Created:
Nov 17, 2021 11:00 AM
| Last Modified: Nov 17, 2021 8:01 AM
(1387 views)
| Posted in reply to message from Shinyi 11-17-2021
First, welcome to the community. If you simply select the Format drop down, you can select Percent
"All models are wrong, some are useful" G.E.P. Box
Recommended Articles
- © 2026 JMP Statistical Discovery LLC. All Rights Reserved.
- Terms of Use
- Privacy Statement
- Contact Us


