- Subscribe to RSS Feed
- Mark Topic as New
- Mark Topic as Read
- Float this Topic for Current User
- Bookmark
- Subscribe
- Mute
- Printer Friendly Page
Discussions
Solve problems, and share tips and tricks with other JMP users.- JMP User Community
- :
- Discussions
- :
- Animated Forward Curve Graph
- Mark as New
- Bookmark
- Subscribe
- Mute
- Subscribe to RSS Feed
- Get Direct Link
- Report Inappropriate Content
Animated Forward Curve Graph
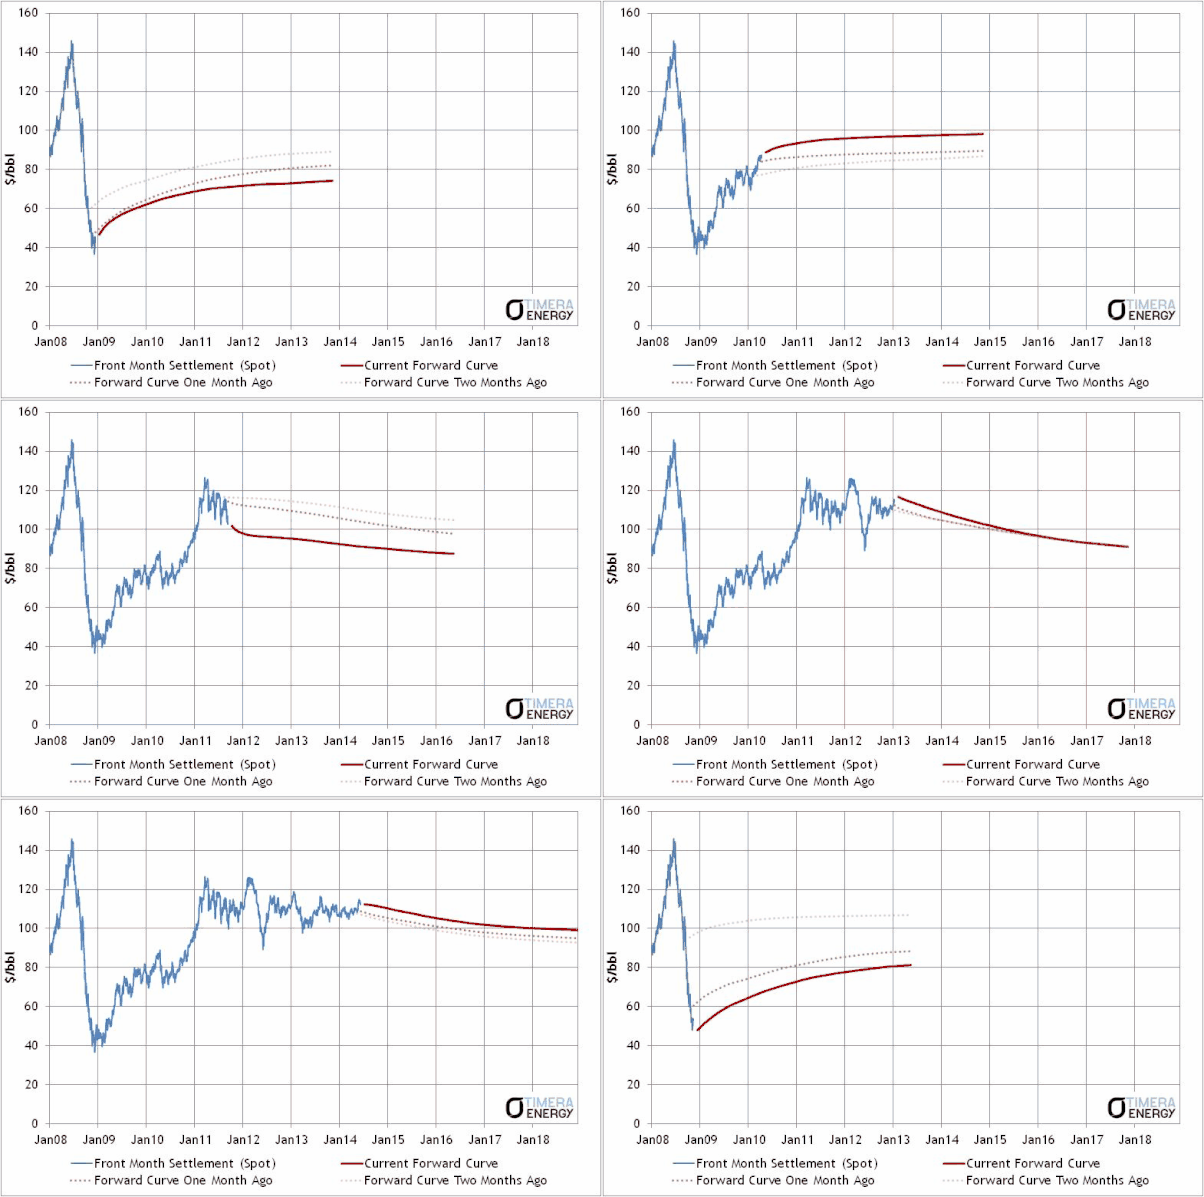
May I ask whether JMP allows me to build an animated forward curve graph as attached.
https://timera-energy.com/the-dangers-of-mixing-forecasts-and-forward-curves/
- Mark as New
- Bookmark
- Subscribe
- Mute
- Subscribe to RSS Feed
- Get Direct Link
- Report Inappropriate Content
Re: Animated Forward Curve Graph
The 'animation' part is easy as this script shows. But here the 'forward curve' is just a straight line, but you would need to look into how that's actually calculated:
NamesDefaultToHere(1);

// Make some data
dt = NewTable("Data", NewColumn("Value", Numeric, Continuous, Formula(RandomNormal(0,1))));
dt << addRows(10);

// Graph the data (this script was built by JMP, apart from the 'add graphics script' part)
dt << Graph Builder(
	Size( 535, 467 ),
	Show Control Panel( 0 ),
	Variables( X( Transform Column( "Row", Formula( Row() ) ) ), Y( :Value ) ),
	Elements( Line( X, Y, Legend( 8 ) ) ),
	SendToReport(
		Dispatch(
			{},
			"Row",
			ScaleBox,
			{Min( 0 ), Max( 40 ), Inc( 2 ), Minor Ticks( 1 )}
		),
		Dispatch(
			{},
			"Value",
			ScaleBox,
			{Min( 3 ), Max( -3 ), Inc( 1 ), Minor Ticks( 0 )}
		),
		Dispatch(
			{},
			"Graph Builder",
			FrameBox,
			{Add Graphics Script(
				2,
				Description( "Script" ),
				Pen Color( "Red" );
				Line Style( "Dotted" );
				dt = Data Table( "Data" );
				Line( {N Row( dt ), :Value[N Row( dt )]}, {40, 0} );
			), Grid Line Order( 1 ), Reference Line Order( 3 )}
		)
	)
);

// Add some new data
for(p=11, p<=40, p++, Wait(0.1); dt << addRow(1));- Mark as New
- Bookmark
- Subscribe
- Mute
- Subscribe to RSS Feed
- Get Direct Link
- Report Inappropriate Content
Re: Animated Forward Curve Graph
Hi Ian
Thank you very much.
I will experiment with it and see where it leads...much appreciated...
- Mark as New
- Bookmark
- Subscribe
- Mute
- Subscribe to RSS Feed
- Get Direct Link
- Report Inappropriate Content
Re: Animated Forward Curve Graph
Hi Ian
Further to your helpful response, I am wondering whether the script need to modified to fit this price dataset. Essentially the x-axis is the trading date and the Y-axis are the spot month (represent the price graph) and M01 to M24 months (represent the forward curve "line" for 1st to 24th month prices as it work through the time series.)
I know my request may came across a bit imposing. As I am a newbie on JMP graph builder; I was hoping that if your time permits, you could help me to set that into a JMP dataset and scripts, Through JMP, I could learn the way you did it and i will work through the iterations. It is also okay if you are not able to act on my request if it is not appropriate.
Recommended Articles
- © 2026 JMP Statistical Discovery LLC. All Rights Reserved.
- Terms of Use
- Privacy Statement
- Contact Us

