- JMP will suspend normal business operations for our Winter Holiday beginning on Wednesday, Dec. 24, 2025, at 5:00 p.m. ET (2:00 p.m. ET for JMP Accounts Receivable).
Regular business hours will resume at 9:00 a.m. EST on Friday, Jan. 2, 2026. - We’re retiring the File Exchange at the end of this year. The JMP Marketplace is now your destination for add-ins and extensions.
- Subscribe to RSS Feed
- Mark Topic as New
- Mark Topic as Read
- Float this Topic for Current User
- Bookmark
- Subscribe
- Mute
- Printer Friendly Page
Discussions
Solve problems, and share tips and tricks with other JMP users.- JMP User Community
- :
- Discussions
- :
- Re: Adding unit to Y-axis of a variability chart

- Mark as New
- Bookmark
- Subscribe
- Mute
- Subscribe to RSS Feed
- Get Direct Link
- Report Inappropriate Content
Adding unit to Y-axis of a variability chart
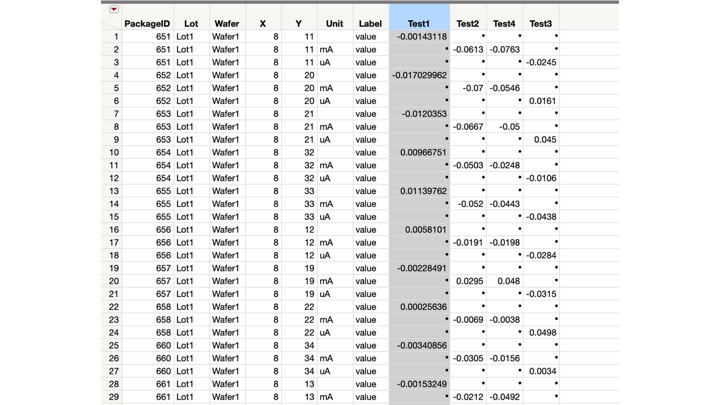
I have a set of test items test across 80 devices. I am plotting the variability chart, i want to add the unit in to Y axis. I have the units in a diferent column. Column name is the default label set. Is there a way to add the units in to the label? any scripts available? attached is the sample sheet and sample format of outout i want.
Accepted Solutions

- Mark as New
- Bookmark
- Subscribe
- Mute
- Subscribe to RSS Feed
- Get Direct Link
- Report Inappropriate Content
Re: Adding unit to Y-axis of a variability chart
Here is a script that produces what you want by adding the Units to the name of the Tests. I ran this against the Excel file that was supplied. The script assumes the data table has opened in JMP prior to running the script.

Names Default To Here( 1 );

// This script assumes you have opened the Excel file as a JMP Data Table
dt = Current Data Table();

// Split the data into the proper form for analysis
dtSplit = dt << Split( Split By( :TestInstance ), Split( :value ), Remaining Columns( Drop( :Unit ) ), Sort by Column Property );

// Create a data table to determine the units for each test
dtUnits = dt << Summary( Group( :TestInstance, :Unit ), Freq( "None" ), Weight( "None" ), Link to original data table( 0 ) );

// Loop across the data table and add the Units to the different Test Columns in the data table
For( i = 1, i <= N Rows( dtUnits ), i++,
	If( dtUnits:Unit[i] != "",
		Column( dtSplit, dtUnits:TestInstance[i] ) << set name(
			Column( dtSplit, dtUnits:TestInstance[i] ) << get name || " ( " || dtUnits:Unit[i] || " )"
		)
	)
);

// Delete the Units data table since it is no longer needed
close( dtUnits, nosave );

// Create a window to place all of the charts into
nw = New Window( "Variability Chart by PackageID", vlb = V List Box() );

// Get all of the column names
colNames = dtSplit << get column names( string, numeric );

// Loop across all of the columns and when a Test column is found,
// then create a chart for it
For( i = 1, i <= N Items( colNames ), i++,
	If( Contains( colNames[i], "Test" ) == 1,
		testList = ":Name(\!"" || colNames[i] || "\!")";
		Eval(
			Substitute(
					Expr(
						vlb << append( dtSplit << Variability Chart( Y( __theList__ ), X( :PackageID ), Std Dev Chart( 0 ) ) )
					),
				Expr( __theList__ ), Parse( testList )
			)
		);
	)
);

- Mark as New
- Bookmark
- Subscribe
- Mute
- Subscribe to RSS Feed
- Get Direct Link
- Report Inappropriate Content
Re: Adding unit to Y-axis of a variability chart
That's effectively what I was thinking for the split. Nice job, Jim.
The alternative approach I was considering would avoid the split and y-axis label would just be unit. If the unit is missing, I just put "Unknown Unit" in its place, but you can do whatever you want there. This approach builds the "SendToByGroup" portion of the script. This works well with your sample data:
Names Default to Here(1);
dt = Current Data Table();

/**** Get units for each level of TestInstance ***/
testList = Associative Array(dt:TestInstance) << get keys;
unitList = {};
for(i = 1, i<=N Items(testList), i++,
	temp = dt:Unit[min(dt << Get Rows Where(:TestInstance == testList[i]))];
	Insert Into(unitList, If(Is Missing(temp),"Unknown Unit", temp ));
);

unitArray = Associative Array(testList, unitList);

/**** Build the Var Chart Script ****/
varChartStr = "Variability Chart(
	Y( :value ),
	X( :PackageID ),
	Std Dev Chart( 0 ),
	By( :TestInstance )";

//Loop through levels of TestInstance to add the unit label for the y-axis
for(i=1, i<= N Items(testList), i++,
	varChartStr = varChartStr || Eval Insert("\[,
SendToByGroup(
		{:TestInstance == "^testList[i]^"},
		SendToReport(
			Dispatch(
				{"Variability Gauge TestInstance=^testList[i]^",
				"Variability Chart for value"},
				"value",
				TextEditBox,
				{Set Text( "^unitArray[testList[i]]^" )}
			)
		)
	)]\");
);

//Close the script
varChartStr = varChartStr || "
);";

//Run the script
eval(parse(varChartStr));

//Add the script to the data table
Eval(Parse(Eval Insert("dt << New Script(\!"Variability Chart\!", ^varChartStr^)")));
Here's the result:

- Mark as New
- Bookmark
- Subscribe
- Mute
- Subscribe to RSS Feed
- Get Direct Link
- Report Inappropriate Content
Re: Adding unit to Y-axis of a variability chart
If you have to do this one time, just click on the axis labels and type in whatever you want. If you have to do this repeatedly, type in what you want and save the script. Point this script at any future table:
Variability Chart(
	SendToByGroup( {:TestInstance == "Test1"} ),
	Y( :value ),
	SendToByGroup( {:TestInstance == "Test1"}, Y( :value ) ),
	SendToByGroup( {:TestInstance == "Test2"}, Y( :value ) ),
	SendToByGroup( {:TestInstance == "Test3"}, Y( :value ) ),
	SendToByGroup( {:TestInstance == "Test4"}, Y( :value ) ),
	X( :PackageID ),
	Std Dev Chart( 0 ),
	By( :TestInstance ),
	SendToByGroup(
		{:TestInstance == "Test1"},
		SendToReport(
			Dispatch(
				{"Variability Gauge TestInstance=Test1",
				"Variability Chart for value"},
				"value",
				TextEditBox,
				{Set Text( "Unknown" )}
			)
		)
	),
	SendToByGroup(
		{:TestInstance == "Test2"},
		SendToReport(
			Dispatch(
				{"Variability Gauge TestInstance=Test2",
				"Variability Chart for value"},
				"value",
				TextEditBox,
				{Set Text( "mA" )}
			)
		)
	),
	SendToByGroup(
		{:TestInstance == "Test3"},
		SendToReport(
			Dispatch(
				{"Variability Gauge TestInstance=Test3",
				"Variability Chart for value"},
				"value",
				TextEditBox,
				{Set Text( "uA" )}
			)
		)
	),
	SendToByGroup(
		{:TestInstance == "Test4"},
		SendToReport(
			Dispatch(
				{"Variability Gauge TestInstance=Test4",
				"Variability Chart for value"},
				"value",
				TextEditBox,
				{Set Text( "mA" )}
			)
		)
	)
)
- Mark as New
- Bookmark
- Subscribe
- Mute
- Subscribe to RSS Feed
- Get Direct Link
- Report Inappropriate Content
Re: Adding unit to Y-axis of a variability chart
Thanks @cwillden but i have 200+ test items so this method may be not suitable for that big set of test items. Do you have any idea to use it with the loop?
thanks.
- Mark as New
- Bookmark
- Subscribe
- Mute
- Subscribe to RSS Feed
- Get Direct Link
- Report Inappropriate Content
Re: Adding unit to Y-axis of a variability chart
I think it would be easier in a wider format (i.e. split the "value" column on TestInstance), but if you want to keep it in the long format, the most straightforward approach might be to construct the SendToByGroup() parts in a loop and grabbing the unit for each by group level. I can certainly help you with that later tonight, but I have to run right now.
- Mark as New
- Bookmark
- Subscribe
- Mute
- Subscribe to RSS Feed
- Get Direct Link
- Report Inappropriate Content
Re: Adding unit to Y-axis of a variability chart
@cwillden thanks, i transposed the sheet shown in the attached format. Pleae show me the way to add unit.
Thanks
- Mark as New
- Bookmark
- Subscribe
- Mute
- Subscribe to RSS Feed
- Get Direct Link
- Report Inappropriate Content
Re: Adding unit to Y-axis of a variability chart
Here is a script that produces what you want by adding the Units to the name of the Tests. I ran this against the Excel file that was supplied. The script assumes the data table has opened in JMP prior to running the script.
Names Default To Here( 1 );

// This script assumes you have opened the Excel file as a JMP Data Table
dt = Current Data Table();

// Split the data into the proper form for analysis
dtSplit = dt << Split( Split By( :TestInstance ), Split( :value ), Remaining Columns( Drop( :Unit ) ), Sort by Column Property );

// Create a data table to determine the units for each test
dtUnits = dt << Summary( Group( :TestInstance, :Unit ), Freq( "None" ), Weight( "None" ), Link to original data table( 0 ) );

// Loop across the data table and add the Units to the different Test Columns in the data table
For( i = 1, i <= N Rows( dtUnits ), i++,
	If( dtUnits:Unit[i] != "",
		Column( dtSplit, dtUnits:TestInstance[i] ) << set name(
			Column( dtSplit, dtUnits:TestInstance[i] ) << get name || " ( " || dtUnits:Unit[i] || " )"
		)
	)
);

// Delete the Units data table since it is no longer needed
close( dtUnits, nosave );

// Create a window to place all of the charts into
nw = New Window( "Variability Chart by PackageID", vlb = V List Box() );

// Get all of the column names
colNames = dtSplit << get column names( string, numeric );

// Loop across all of the columns and when a Test column is found,
// then create a chart for it
For( i = 1, i <= N Items( colNames ), i++,
	If( Contains( colNames[i], "Test" ) == 1,
		testList = ":Name(\!"" || colNames[i] || "\!")";
		Eval(
			Substitute(
					Expr(
						vlb << append( dtSplit << Variability Chart( Y( __theList__ ), X( :PackageID ), Std Dev Chart( 0 ) ) )
					),
				Expr( __theList__ ), Parse( testList )
			)
		);
	)
);
- Mark as New
- Bookmark
- Subscribe
- Mute
- Subscribe to RSS Feed
- Get Direct Link
- Report Inappropriate Content
Re: Adding unit to Y-axis of a variability chart
That's effectively what I was thinking for the split. Nice job, Jim.
The alternative approach I was considering would avoid the split and y-axis label would just be unit. If the unit is missing, I just put "Unknown Unit" in its place, but you can do whatever you want there. This approach builds the "SendToByGroup" portion of the script. This works well with your sample data:
Names Default to Here(1);
dt = Current Data Table();

/**** Get units for each level of TestInstance ***/
testList = Associative Array(dt:TestInstance) << get keys;
unitList = {};
for(i = 1, i<=N Items(testList), i++,
	temp = dt:Unit[min(dt << Get Rows Where(:TestInstance == testList[i]))];
	Insert Into(unitList, If(Is Missing(temp),"Unknown Unit", temp ));
);

unitArray = Associative Array(testList, unitList);

/**** Build the Var Chart Script ****/
varChartStr = "Variability Chart(
	Y( :value ),
	X( :PackageID ),
	Std Dev Chart( 0 ),
	By( :TestInstance )";

//Loop through levels of TestInstance to add the unit label for the y-axis
for(i=1, i<= N Items(testList), i++,
	varChartStr = varChartStr || Eval Insert("\[,
SendToByGroup(
		{:TestInstance == "^testList[i]^"},
		SendToReport(
			Dispatch(
				{"Variability Gauge TestInstance=^testList[i]^",
				"Variability Chart for value"},
				"value",
				TextEditBox,
				{Set Text( "^unitArray[testList[i]]^" )}
			)
		)
	)]\");
);

//Close the script
varChartStr = varChartStr || "
);";

//Run the script
eval(parse(varChartStr));

//Add the script to the data table
Eval(Parse(Eval Insert("dt << New Script(\!"Variability Chart\!", ^varChartStr^)")));
Here's the result:
- Mark as New
- Bookmark
- Subscribe
- Mute
- Subscribe to RSS Feed
- Get Direct Link
- Report Inappropriate Content
Re: Adding unit to Y-axis of a variability chart
Recommended Articles
- © 2025 JMP Statistical Discovery LLC. All Rights Reserved.
- Terms of Use
- Privacy Statement
- Contact Us