cancel
Showing results for 
Show  only  | Search instead for 
Did you mean: 
  • New to JMP? Join us Sept. 23-24 for the Early User Edition of Discovery Summit, tailor-made for new users. Register now for free!
  • Use World Cup data to build models, explore spatial relationships, and create informative visualizations in JMP. Register. July 17, 2 pm US Eastern Time.
  • Your voice matters! Tell us how you prefer to receive JMP updates, so we can tailor our communication to your needs. Take short survey.

Discussions

Solve problems, and share tips and tricks with other JMP users.
Choose Language Hide Translation Bar
Zoe_Betteridge
Level II

Adding reference lines to a log scale

Hi,

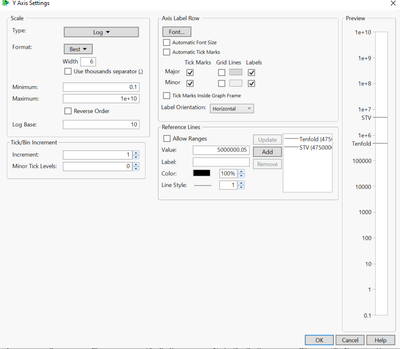
I'm hoping someone has a solution to my issue. I am using graph builder and adding two continuous variables to the Y axis - both require the same log scale. This works okay with a scale from 0.1 to 1e+10 until I try and add the reference lines. I have lines to add at 475000 and 4750000 - which when I add and look at the preview appear to be fine (see screenshot)

Zoe_Betteridge_0-1629378664203.png

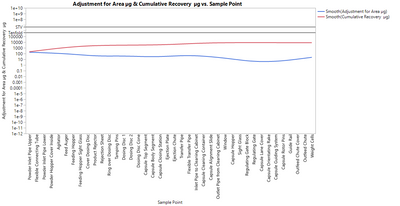
however when I click OK - I get the following plot with lower minimum values that won't change even when I try and edit it.

Zoe_Betteridge_1-1629378831831.png


I have tried adding the axis preferences to the columns in the data table and saving the graph script and editing there but still get the same result. Is there a reason why I can't have the plot starting at 0.1? I can get it two work if I have the two columns as separate graphs but can't get them to overlay.

Thanks Zoe.

1 REPLY 1
ih
Super User (Alumni) ih
Super User (Alumni)

Re: Adding reference lines to a log scale

Hi @Zoe_Betteridge,


I cannot seem to replicate your issue.  If you run the script below are you able to adjust those axis limits?


Names default to here(1);

dt = Open("$Sample_data/Big class.jmp");

New Column("Exp[height]", Numeric, "Continuous", Format("Best", 12), Formula(Exp(:height / 20)));
New Column("Exp[weight]", Numeric, "Continuous", Format("Best", 12), Formula(Exp(:weight / 20)));

Graph Builder(
	Size( 763, 619 ),
	Show Control Panel( 0 ),
	Variables(
		X( :name ),
		Y( :"Exp[height]"n ),
		Y( :"Exp[weight]"n, Position( 1 ) )
	),
	Elements( Line( X, Y( 1 ), Y( 2 ), Legend( 4 ) ) ),
	SendToReport(
		Dispatch(
			{},
			"Exp[height]",
			ScaleBox,
			{Scale( "Log" ), Format( "Best", 6 ), Min( 1.07137524526672 ),
			Max( 3564457.95421388 ), Inc( 1 ), Minor Ticks( 0 ),
			Add Ref Line( 100000, "Solid", "Black", "a", 1 ),
			Add Ref Line( 1000000, "Solid", "Black", "b", 1 )}
		)
	)
);

Recommended Articles