- New to JMP? Join us Sept. 23-24 for the Early User Edition of Discovery Summit, tailor-made for new users. Register now for free!
- Your voice matters! Tell us how you prefer to receive JMP updates, so we can tailor our communication to your needs. Take short survey.
- See how to access JMP Marketplace - and - find, create & share add-ins to extend your JMP. Watch video.
- Subscribe to RSS Feed
- Mark Topic as New
- Mark Topic as Read
- Float this Topic for Current User
- Bookmark
- Subscribe
- Mute
- Printer Friendly Page
Discussions
Solve problems, and share tips and tricks with other JMP users.- JMP User Community
- :
- Discussions
- :
- ANOVA with Binary Data - What do these extreme outliers mean?

- Mark as New
- Bookmark
- Subscribe
- Mute
- Subscribe to RSS Feed
- Get Direct Link
- Report Inappropriate Content
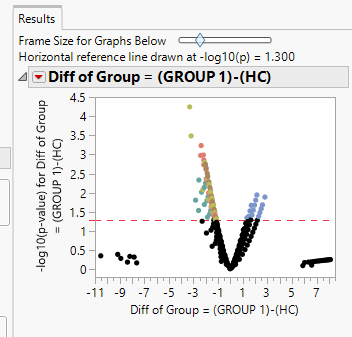
ANOVA with Binary Data - What do these extreme outliers mean?
Hello, I have a large set of binary data (0, 1). I am using JMP Genomics ANOVA to compare the means between two groups. I was expecting a significant difference between Group 1 and HC for certain genes that are not represented as significant on the volcano plot nor the associated data. For example, For Gene S Group 1 has 100% homogeneity (mean of 1) and HC has a mean of 0.2. However, the volcano plot (attached) shows an X value of -10 and Y value of only 0.3 (where a Y value of 1.3 is significant). Can you tell me what leads to these extreme X-axis values that are not significant? There are two groups on the X axis which do not participate in the V with the other points and I'm not sure what these outliers mean.
I want to make sure I'm using the right settings for my data since I really expected genes like Gene S to be significantly different between the groups.
Below are some specific settings:
Model Distribution: Binary
Link Function: Logit
Simple Differences
Multiple Testing Method: FDR
-log10(p-value) Cutoff: 1.3
I have also included the data input I used for ANOVA and also the associated data output for just Gene S as an example.
Also, can anyone point me to the documentation for the specific formulas used to calculate the ANOVA and associated data? When I calculated the LSMean by hand, I got a different result than JMP got so I am wanting to see what specifically is being calculated to obtain the data in the associated data file.
Thank you SO much for any help!!!

- Mark as New
- Bookmark
- Subscribe
- Mute
- Subscribe to RSS Feed
- Get Direct Link
- Report Inappropriate Content
Re: ANOVA with Binary Data - What do these extreme outliers mean?
Hi @JMPUser5400 ,
If you are using ANOVA the documentation starts here: Process Description (jmp.com)
However, within the dialog for ANOVA, there are "?" next to each option that does give more information. One thing to be aware of is that each tab has a set of default options. One that might be giving you problems is in the Options tab where Standardization Method is set to STD. I dont think you need this since you have binary data. Try choosing the empty space option at the top which means no standardization method is used.
Without seeing the actual data, it is hard to troubleshoot why you are getting soemthign different than expected. Variance for each group contributes to the p-value even in larger mean differences. So in HC, there could be a mean of 0.2 of all of the 1s but the variance could be very large. Also, a variance of 0 in Group 1 (all 1s) might also cause problems.
I suspect the issue might be the Standardization Method.
You can also contact [email protected] to get deep into the implementation details as well as additional help on the matter if the data is sensitive.
Cheers,
Data Scientist, Life Sciences - Global Technical Enablement
JMP Statistical Discovery, LLC. - Denver, CO
Tel: +1-919-531-9927 ▪ Mobile: +1-303-378-7419 ▪ E-mail: [email protected]
www.jmp.com
- Mark as New
- Bookmark
- Subscribe
- Mute
- Subscribe to RSS Feed
- Get Direct Link
- Report Inappropriate Content
Re: ANOVA with Binary Data - What do these extreme outliers mean?
Hi @Chris_Kirchberg ,
Thank you for your response! Changing the Standardization Method to being blank didn't fix the problem, unfortunately, but thank you for the suggestion.
I have attached the input data I used for the ANOVA analysis as well as the output "associated data" that JMP generated. It is anonymized, but Gene S corresponds to Gene #7092. Is this the data you need? I'm happy to send anything that will be helpful in solving this problem!
Also, I have read all of the "?" and JMP Genomics User's Guides on ANOVA, however, none of them list the specific formulas used in these computations, unfortunately.
Thanks again!
- Mark as New
- Bookmark
- Subscribe
- Mute
- Subscribe to RSS Feed
- Get Direct Link
- Report Inappropriate Content
Re: ANOVA with Binary Data - What do these extreme outliers mean?
Thanks @JMPUser5400 ,
This is exactly what I was hoping to see. I have tried the gene 7092 by itself and with all other genes and get the same p-value as you did within JMP Genomics. I tried using JMP by itself (gene 7092 as Y and the two groups as X in Fit Y by X, either using One-way ANOVA or Contingency) and get a very small p-value that would satisfy the cutoff of -log10(p-value) = 1.3 cutoff and thus statistically significant. I would contact technical support ([email protected]) to figure out why there is such a difference since I cannot explain why it would be so very different. I too must be missing something.
You can also use the Response Screening platform under Analyze>Screening menu at the top and be able to perform the same task as JMP Genomics ANOVA. The only difference is that you would have to import the Excel file within JMP (easy drag and drop and make sure the first two rows are headers), Transpose the data, then parse out the column with group and sample info into two columns (text to columns under Cols>Utilities). The output of response screening does not give you a volcano plot, but if you choose Save Compare Means from the red triangle next to Response Screening, you can then make a volcano plot using difference as X and then create a column that transforms Plain Dif PValue to -log10(p-value) to plot on Y.
Question: When you calculate LSMeans by hand, how are you doing it?
By the way, we are using SAS PROC GLIMMIX for the ANOVA model in JMP Genomics (Overview: PROC GLIMMIX :: SAS/STAT(R) 13.1 User's Guide). This link has a lot of details and options that we do not use in JMP Genomics, but gives the basis of the mathematics behind each option, when appropriate.
Also to note, the p-values shown in the volcano plot are not FDR corrected. Only the horizontal line (cutoff) is corrected. So when you use the Enter new -log10(p) cutoff value of 1.3, it is showing a line for the cutoff of each gene with an uncorrected p-value.
Data Scientist, Life Sciences - Global Technical Enablement
JMP Statistical Discovery, LLC. - Denver, CO
Tel: +1-919-531-9927 ▪ Mobile: +1-303-378-7419 ▪ E-mail: [email protected]
www.jmp.com
- Mark as New
- Bookmark
- Subscribe
- Mute
- Subscribe to RSS Feed
- Get Direct Link
- Report Inappropriate Content
Re: ANOVA with Binary Data - What do these extreme outliers mean?
Hi Chris,
Thank you for your response. Were you able to specify Binary and Logit methods on JMP Pro? I have JMP Pro, however, I am not well versed in it and can't find those specifications for the Oneway analysis there. In this case, the JMP Pro is probably assuming a normal distribution and thus giving a different answer. The calculations I did by hand also assumed a normal distribution (I just did a classic sum of squared means and F test approach), and the P value was VERY low (like .0000004). Even though the model isn't correct, I agree that it's weird that the binary approach would change the P value so much. Especially when there are other genes for which the data look worse but the p value is significant. I can reach out to technical support about these differences, however, would you mind explaining how you got the JMP Pro result so I can pass the information along to them? Thank you!
In your first response you mentioned the variance being an issue. After looking at the data, do you think that could be the problem? The data for Group 1 is too homogenous? If so, how could I fix this?
Thank you for the information about the GLIMMIX! I hadn't found that resource.
- Mark as New
- Bookmark
- Subscribe
- Mute
- Subscribe to RSS Feed
- Get Direct Link
- Report Inappropriate Content
Re: ANOVA with Binary Data - What do these extreme outliers mean?
Hi @JMPUser5400 ,
Binary distribution is not an option in JMP Pro, but Binomial is (same link function). Binomial Distribution will give a similar result as Binary in JMP Genomics (except differences will be positive instead of negative because it will be Group 1 - HC which would end up as a positive difference and it has the same issue as the Binary distribution). I would definitely contact support regarding the results you get in JMP Genomics for this binary data.
Fit Model will not accept more than two responses for Binomial Distribution, but if you choose to make all of the genes as Numeric and Nominal (categorical), then use Response Screening, you will get differences and p-values similar to what you would get using Binomial Distribution. One-way ANOVA does assume a normal distribution with each group having equal variance as a default, but there are other means comparison tests that do not.
I am not sure about the variance comment, but the variance would be 0 for a homogeneous response of 1 in one group for ANOVA. I think that is why a Binary or Binomial Distribution would work better and defining the genes as Numeric but Nominal/Categorical might be the better way to go.
So what I did to investigate gene 7092 is use Fit Y by X with it defined as a continuous variable but also as a Nominal variable (different tests performed but get similar results). I then looked at Response Screen for all of the genes with them defined as either Continuous or Nominal variables and looked at the results. Then compared to what JMP Genomics reported for p-values. Differences looked the same (as they should).
Data Scientist, Life Sciences - Global Technical Enablement
JMP Statistical Discovery, LLC. - Denver, CO
Tel: +1-919-531-9927 ▪ Mobile: +1-303-378-7419 ▪ E-mail: [email protected]
www.jmp.com
Recommended Articles
- © 2026 JMP Statistical Discovery LLC. All Rights Reserved.
- Terms of Use
- Privacy Statement
- Contact Us