- Discovery Summit 2026: Early User Edition - September 23-24.Register. It's free.
- Graph Builder Toolbar streamlines interactive graphing. Creates shortcuts on Report and GraphBuilder Helpers toolbars. Download and install the extension.
- Subscribe to RSS Feed
- Mark Topic as New
- Mark Topic as Read
- Float this Topic for Current User
- Bookmark
- Subscribe
- Mute
- Printer Friendly Page
Discussions
Solve problems, and share tips and tricks with other JMP users.- User Community
- :
- Discussions
- :
- Re: 4PL fit failure

- Mark as New
- Bookmark
- Subscribe
- Mute
- Subscribe to RSS Feed
- Get Direct Link
- Report Inappropriate Content
4PL fit failure
I am trying to get to the bottom of an odd observation when trying to fit data using a 4PL. In short, when I fit my data I end up with a flat line:
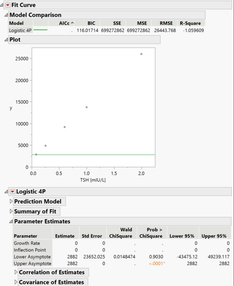
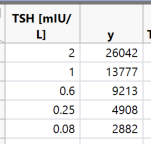
If I do any of the following I end up with a more proper looking fit, and I am sure that other minor changes to the numbers themselves may also fix this bug:
- Change 0.08 to 0.0800000001
- Change 26042 to 26043
- Invert the way the data is within the table (weirdest one to me because it is the same exact numbers)
Here is the resulting fit:
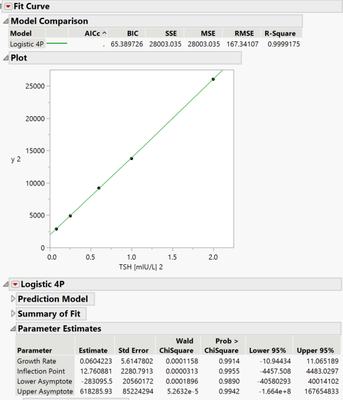
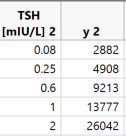
Regardless of whether this is the correct fit to use for this data set, it is strange to see this odd behavior. If there is another explanation other than a bug/glitch and someone can explain that would be amazing!


- Mark as New
- Bookmark
- Subscribe
- Mute
- Subscribe to RSS Feed
- Get Direct Link
- Report Inappropriate Content
Re: 4PL fit failure
It is an intriguing finding indeed. I wonder if the cause of this is related to the fact that your data appears to fit almost perfectly a linear regression, leaving no space for JMP to estimate the inflection point in your 4PL fit. Just a thought but no obvious solution here.
Best,
TS
- Mark as New
- Bookmark
- Subscribe
- Mute
- Subscribe to RSS Feed
- Get Direct Link
- Report Inappropriate Content
Re: 4PL fit failure
Thanks for the reply. I completely agree the data is fit very well with a standard linear regression, and chances are when we have a more complete dataset to fit this won't pop up (fingers crossed!). It was more puzzling due to the small changes to the numbers themselves or the orientation of the data within the table resulting in JMP being able to fit the 4PL. A few other notes to add to the weirdness:
- a 5 PL fit works fine with the data in the orientation that does not work for the 4PL fit
- Duplication of the data so as to simply have 10 rows, N=2 duplicate rows for each entry, also results in the 4PL fit working.

- Mark as New
- Bookmark
- Subscribe
- Mute
- Subscribe to RSS Feed
- Get Direct Link
- Report Inappropriate Content
Re: 4PL fit failure
Dear @P_Desmond , I agree, that the behaviour is not correct, perhaps there is some singularity in that algorithm with your first dataset. You can send your example to the JMP support [email protected].
But please recognize, that for excactly your example data, logistic 4P is not the best model.
In that example below I used the manual fit Logistic 4P (nonlinear platform), to have a picture, what the curve typically looks like. Choice of model always is crucial.

Recommended Articles
- © 2026 JMP Statistical Discovery LLC. All Rights Reserved.
- Terms of Use
- Privacy Statement
- Contact Us