I saw the following post recently on Twitter:
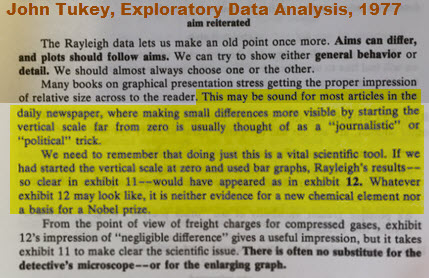
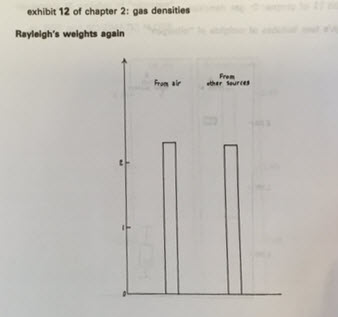
It generated several dissenting replies, including one from me. Coincidentally, I had just re-read part of John Tukey's classic book "Exploratory Data Analysis" (1977) in which he shows a good counter-example to that guideline. The point comes from a discussion introducing a variation of a box plot called a "schematic plot." He introduced the general box plot in 1969, and the schematic plot refined the box plot with a specific set of rules for the whisker lengths and outlier displays, which has always been the default in JMP where it's called an "outlier box plot."
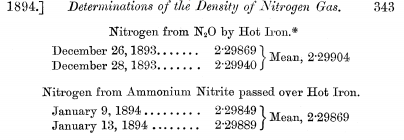
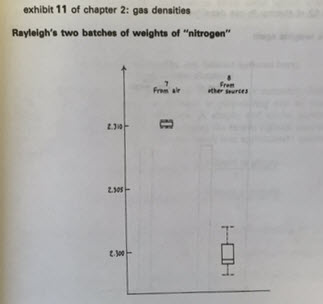
The example in question uses Lord Rayleigh's measurements of the mass of nitrogen. It's a very small data set by today's standards and Tukey nicely lists the data in his book. I also checked Lord Rayleigh's publication, On an anomaly encountered in determinations on the density of nitrogen gas, 1894 which contains a few more observations and a couple minor differences from Tukey's data. I've attached CSV and JMP versions of the data set, with Tukey's data in a separate column.
Importantly, the measurements record the details about how the nitrogen itself was produced. The graph below shows the recorded weight (in grams per "globe") versus the origin and the purifying agent.
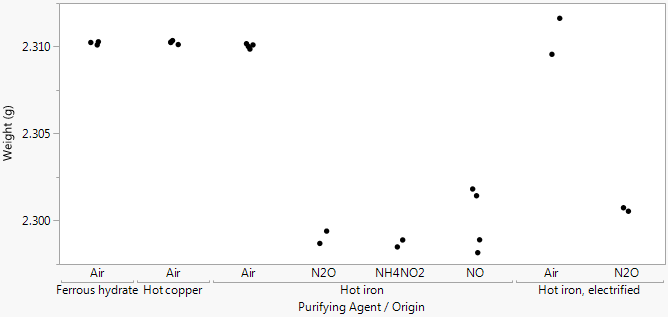
The main difference is whether the nitrogen comes from air or not, which is how Tukey shows it. Here are some of his text and figures.
Although Tukey is comparing summary views (box plot vs. mean bar chart), his point holds for raw data as well. Here are JMP scatter plot versions of those plots.
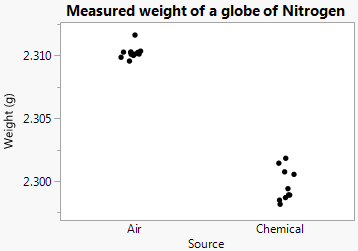

It turns out that Lord Rayleigh's "nitrogen" from air also contained other elements unknown at the time, and the small differences led to the discovery of the element argon, for which he won a Nobel Prize.
So while a zero scale is often wise for comparison graphs, there is no substitute for making an intelligent choice. As Tukey suggests, the zero-origin plot doesn't make the case for a Nobel Prize.

You must be a registered user to add a comment. If you've already registered, sign in. Otherwise, register and sign in.