cancel
Showing results for 
Show  only  | Search instead for 
Did you mean: 
  • Don’t miss your chance to experience Discovery Summit Europe at our best available rate! Early bird registration through 31 Oct.
  • Graph Builder Toolbar streamlines interactive graphing. Creates shortcuts on Report and GraphBuilder Helpers toolbars. Download and install the extension.
  • JMP will suspend normal business operations for our Rest and Recharge Day on Friday, October 2, 2026.
    Regular business hours will resume on Monday, October 5, 2026.

JMPer Cable Blog

A technical blog for JMP users of all levels, full of how-to's, tips and tricks, and detailed information on JMP features
Choose Language Hide Translation Bar
XanGregg
Staff
How to make a bar chart in JMP

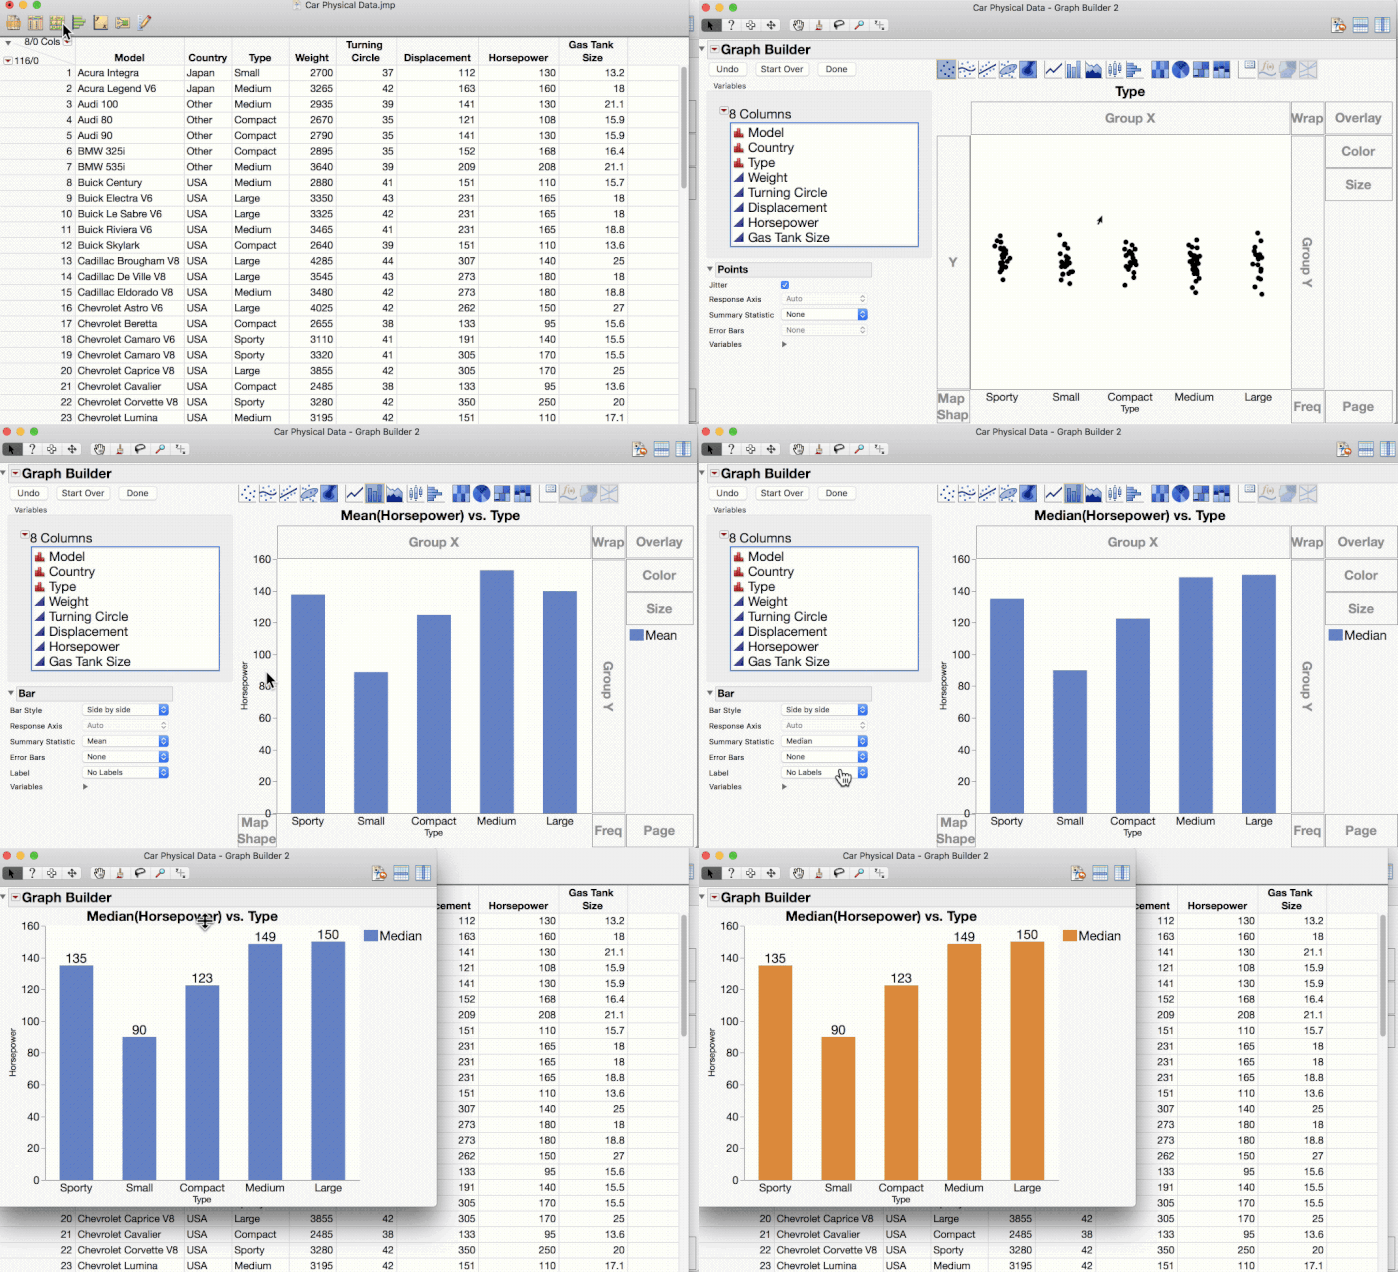
Here's an animated GIF showing how to make a basic bar chart in JMP with some minor customizations.
BarChart.gif


Steps:

  1. Open Graph Builder.
  2. Drag category variable (Type) to the X axis.
  3. Switch element type from Points to Bar, producing a bar chart by count.
  4. Drag a measure variable (Horsepower) to the Y axis.
  5. Change summary statistic as desired.
  6. Add label if desired.
  7. Click Done, closing the control panel.
  8. Right-click on legend to change color as desired.
Last Modified: Sep 5, 2017 10:33 AM