Editor’s Note: This monthly blog from Scott Wise, JMP Principal Engineer, seeks to find interesting uses of statistical discovery to solve deep questions dealing with business/economics, sports, history, health and psychology. This month’s entry asks the question “Is Urban Living Making My Allergies Worse?”
Arriving with the fall allergy seasons are a ton of articles predicting increasing allergy misery. One of the main reasons always cited is our increased urbanization. My home city of Austin, Texas is particularly cited as being one of the worst places for allergies. So maybe we should all pack our bags and head out of the city! However, I always identified with Eva Gabor’s character Lisa Douglas in Green Acres who sang in the opening theme song, “New York is where I'd rather stay, I get allergic smelling hay.” So we will turn to statistical exploration to help answer this question!

Our first challenge is to get relevant data on allergies in both urban and non-urban areas. Once again we turned to our friends at the CDC and found a great public study which surveyed allergic conditions among children in three year periods starting from 1997 until 2014 (http://www.cdc.gov/nchs/hdi.htm). The survey results provide the percentage of children who reported having hay fever or other respiratory allergies within the past twelve months. To further help with our challenge, the results also include separate numbers by location (US, regional and sub-regional census tracts), urbanicity (metropolitan or nonmetropolitan), and age of the child (we will focus on children aged 10-17).
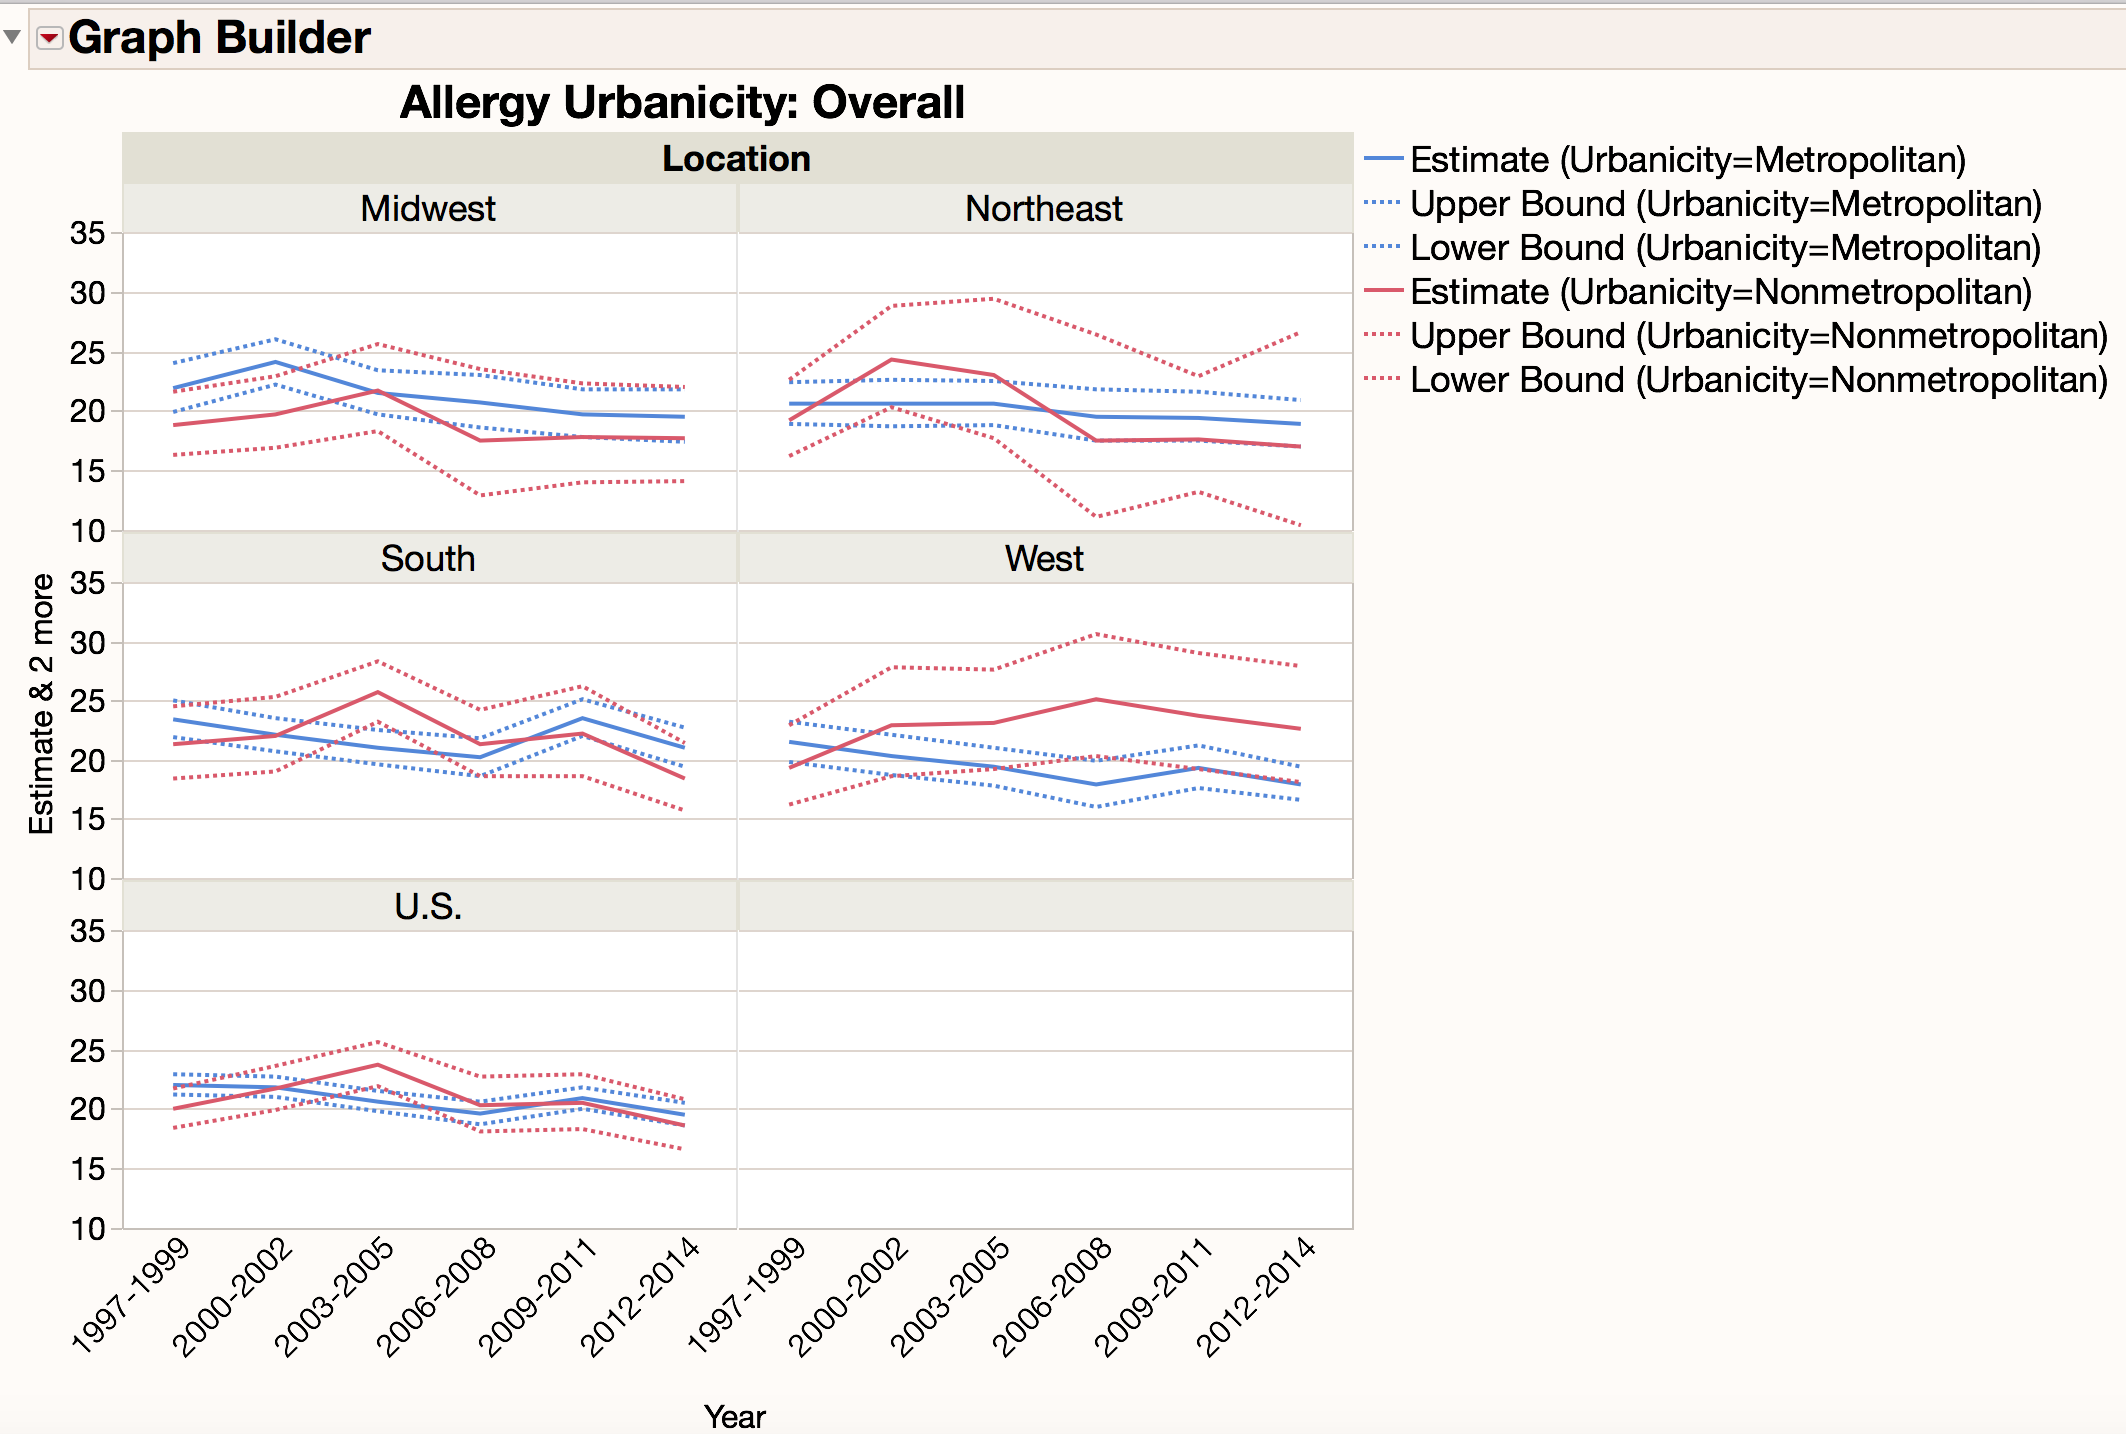
A quick look at the Trend Graph below shows two things about overall allergy trends. First there doesn’t seem to be any visual trends showing increasing allergy percentage rates over time. If anything, the US trends seem to be decreasing slightly over time. Second there doesn’t seem to be any observable instances where metropolitan areas exhibit a higher allergy percentage than non-metropolitan. In most of the regions (Midwest, Northeast and the South) both estimates of urbanicity are very closely located next to each other and have overlapping bounds (which are the 95% confidence intervals around the sampling estimate). Only the West shows a visual difference where the estimates and bands separate, but with nonmetropolitan allergy rates coming out as the highest.

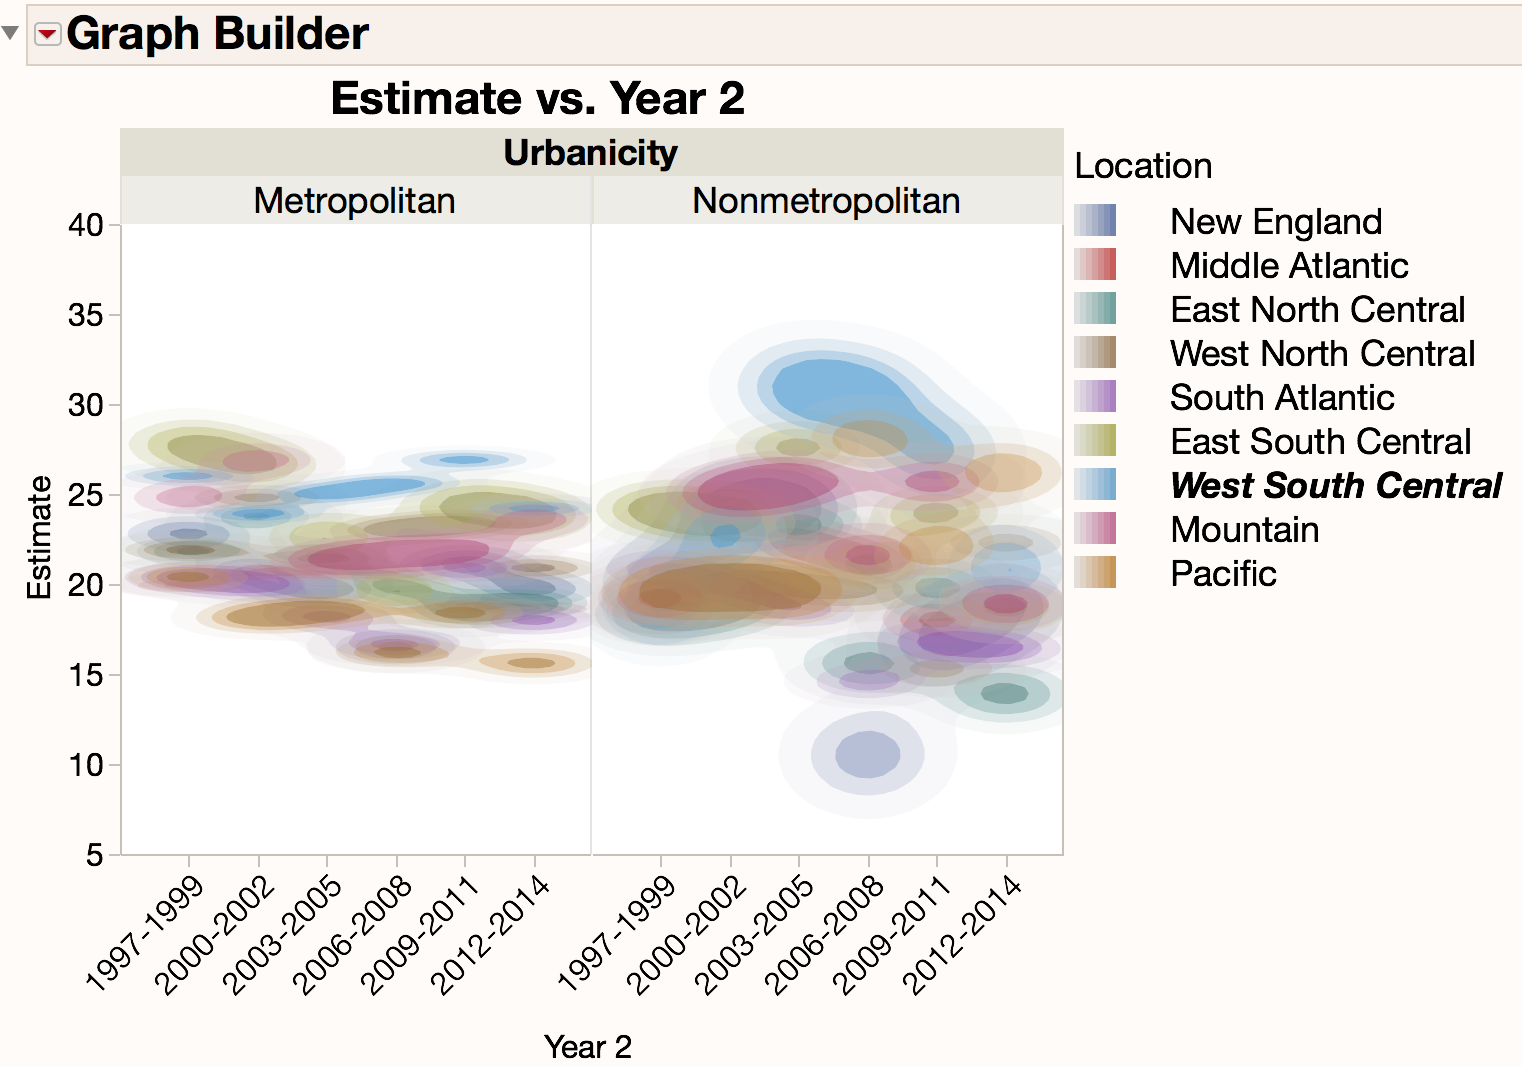
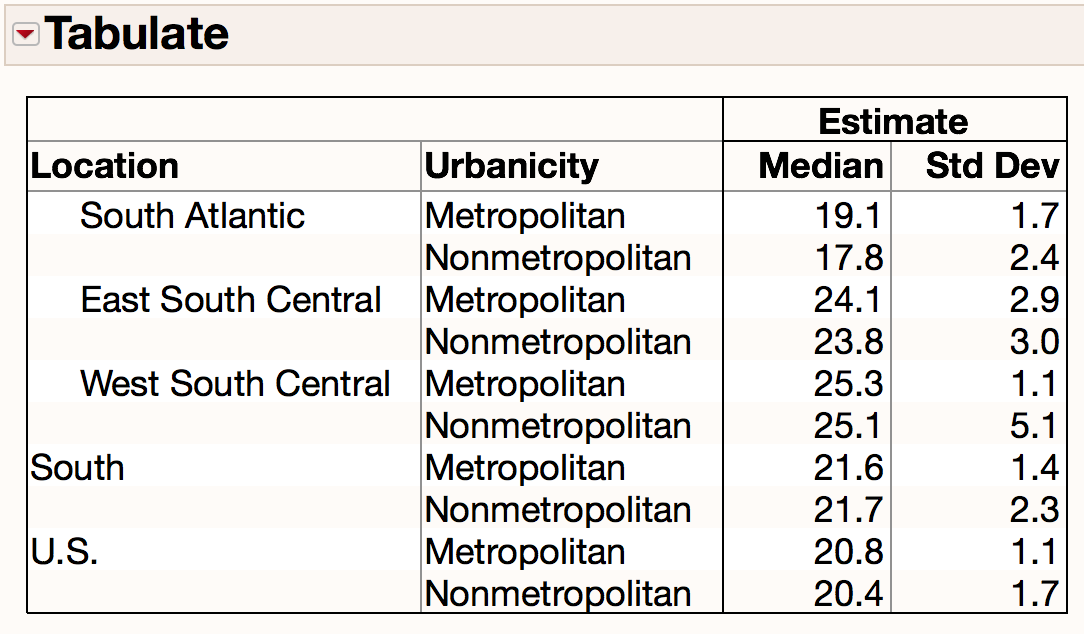
We next look deeper within the sub-regional census tracts. By looking at the Contour Plot below we can see the regions of data density represented by the colored areas. There does seem to be some variation in levels of allergy estimates, especially in nonmetropolitan areas where the highest are seen in the West South Central (which includes states like Texas) and the lowest being in the New England states. Also looking at the Tabulate table below, estimates in the West South Central are almost four percentage points higher than the South regional and US estimates. Therefore, there may be some truth in the claim that Southern cities like Austin may warrant a reputation for slightly higher allergy risk.


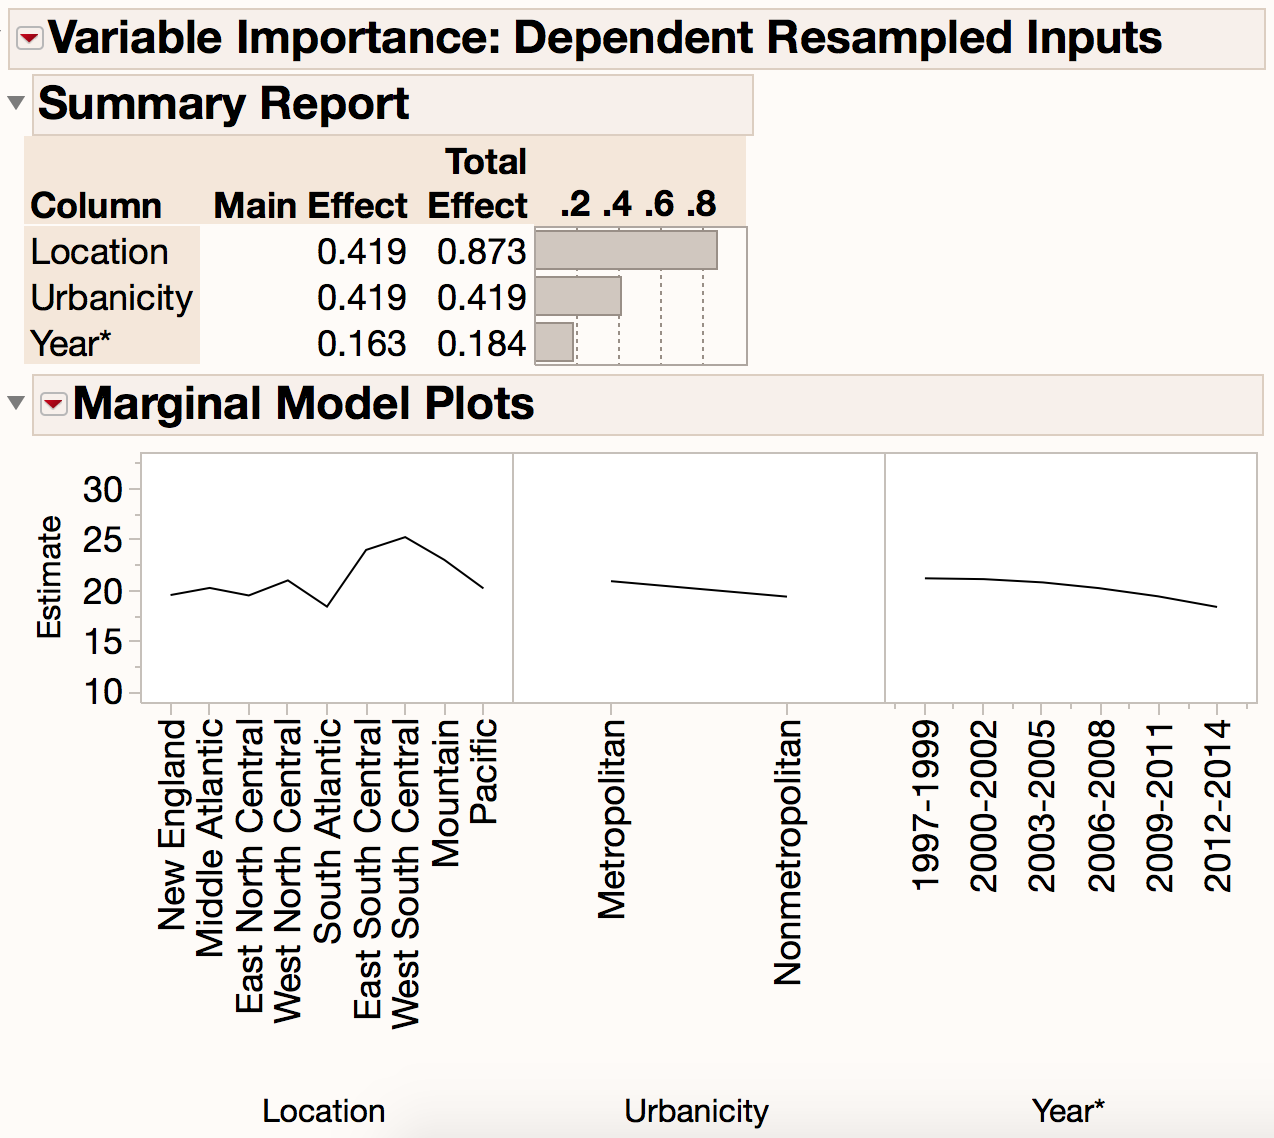
Lastly we threw all the sub-regions, urbanicity and years as factors into a standard least square regression model to better understand their importance on allergy estimates. We can then perform a model simulation technique called Variable Importance to test the relative importance of each factor on allergy estimate predictions. Looking at the bars in the graph below, we can see the biggest grey bar length for location indicating it is the most important of all the factors. Looking further at the Marginal Model Plots below, you can see the higher estimate prediction lines for some of the sub-region census locations such as the West South Central, whereas the lines for both types of urbanicity and all the year periods are relatively flat indicating a much smaller impact.

So with this information we fail to see noticeable differences between urban and city allergy rates, nor evidence of increasing allergy levels over the past seventeen years of the study. However, there does seems to be some difference in sub-regions of the country, especially in the Southern regions where a warmer growing season apparently provides more opportunity for pollen producing trees to wreck havoc on your allergies. And individual experiences will definitely vary, especially if the allergy types you are most sensitive to are prevalent and high in your location. But as is often the case, the grass is not always greener somewhere else as there seems to be allergies to be had everywhere that can keep you sneezing throughout the country.
Perhaps the soundest advice we found is to definitely get tested and find out the things to which you are most allergic so you can take steps to reduce or avoid the effects. Best of luck during this allergy season and keep those tissues handy!
You must be a registered user to add a comment. If you've already registered, sign in. Otherwise, register and sign in.