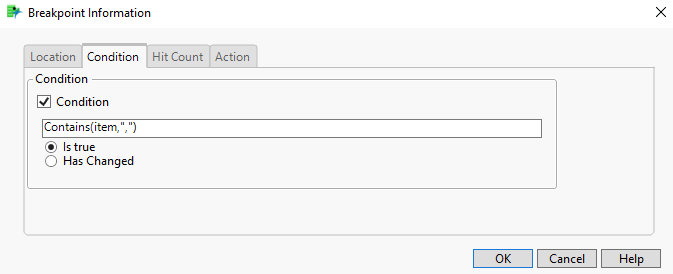
For this recipe, we will look at what makes the JSL debugger truly powerful, conditional breakpoints. This feature lets us pause a script when a specific condition is met, such as when a variable reaches a certain value. With it, we can target specific input values, loop iterations, column numbers, etc. We will use the same program as we did for the JSL Debugger – Getting Started recipe. It has been slightly modified to help illustrate the points in this recipe.
Ingredients:
Data Table – CVC9
Difficulty: Easy
Steps:
- Open the CVC 9 data table and Build CVC List script. Launch the debugger. Set breakpoints on lines 25, 40, and 46. We will be interested in seeing that input strings are parsed correctly. To reiterate information from the previous recipe:
-
Blank cells are removed
-
Cells starting with “[ v.” are ignored.
-
Commas separate individual words.
-
A slash (/) gives a list of words to combine one or more words after the tilde (~). For example, tener/llevar ~ barba/bigote/gafas is to expanded to six words: tener barba, llevar barba, tener bigote, llevar bigote, tener gafas, llevar gafas. There may be more than two lists in a cell
-
There may be both slashes and commas in a cell. The entry: tronco, extremidad ~ superior/inferior, should be expanded to: tronco, extremidad superior, extremidad inferior.
- Right click the breakpoint on line 25 and select Edit Breakpoint. In the dialog box select the Condition tab. Check the Condition check box and add the condition Contains(item,”,”). item is a variable we will be watching. The Is True radio button should be selected. Click OK. A plus appears in the breakpoint dot indicating it is a conditional breakpoint.

- Add item, tildeGroup, and builtCartesian to the list of watched variables.
- Click the Run button at the top left of the debugger. When prompted, select Section for the Level column and the next three columns for Data columns. Click the Run button in the dialog.
- The debugger should be stopped on line 25. The variable item contains the string “pelo, ojo, nariz”. The conditional breakpoint has skipped all cells where there is no comma.
- Click Run twice more. The variable tildeGroup contains {“pelo”}.
- Click Run once more. tildeGroup now contains {“ojo”}. It appears that strings with only commas are being parsed correctly.
- Next, we should check that cells containing tildes are being parsed correctly. We can do this by editing the current conditional breakpoint. In the lower right of the debugger, select the Breakpoints tab. Select the line containing the conditional breakpoint and click the Edit Breakpoint button at the top of the tab (second from the left). Click on the cell in the Condition column containing the breakpoint condition. Edit it to be Contains(item,”~”). Alternatively, we could have edited the line directly in the breakpoints table.
- Unselect the check boxes for the breakpoints on lines 40 and 46. This lets us turn off the breakpoints without deleting them.

- Click the Run button. The debugger will stop at the breakpoint on line 24 for the next observation where item contains a tilde. (Note: if the debugger stops, but item does not contain a tilde, it may be that the debugger was prematurely stopped prior to running to completion. Click the Run without breakpoints button and retry.)
- Next, we will check items with both a tilde and comma. Modify the condition on breakpoint 24 to
Contains(item,"~") & Contains(item,",")
- Click Run. We can now iterate through items with both these characters.
When iterating through a large number of items, it can be difficult to determine where or why an issue arises. While the debugger is typically used to step through a script, it can also be used to help diagnose more serious problems.
- Run the program without the debugger, this time selecting Section for the Level column and all the remaining columns for Data columns.
- After clicking Run, we get an error dialog. The information in the log indicates there is a subscripting problem but doesn’t give much detail other than it involved a column and was likely because of the variable targetRows.

- Relaunch the program in the debugger and click the Run without breakpoints button.
- After dismissing the warning dialog, control is passed back to the debugger. We can now explore various variable values. In particular, we can easily identify the problem column as 10.1. Acciones relacionadas con la Vivienda and that targetRows is empty.
Hints for Success:
- Use conditional breakpoints to target how and when a breakpoint is used to stop.
- The debugger can be used to determine variable values at the time of failure when errors are not easily found using the log.