What inspired this wish list request? color data representation and visualization are essential for all different kind of users community. Sometime, we use color to match county, customer company to make story more appealing. It seems current JMP14 JSL does not allow the flexibility to let user assign special color in the color legend.
What is the improvement you would like to see?
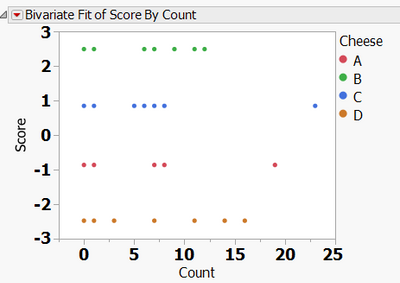
Take Cheese.jmp as an example, the JSL script is shown below
It will be helpful that JSL allows users to assign and define color. For example, JSL can assign cheese A as pink color
Bivariate(
Y( :Score ),
X( :Count ),
SendToReport(
Dispatch(
{},
"Bivar Plot",
FrameBox,
{Row Legend(
Cheese,
Color( 1 ),
Color Theme( "JMP Default" ),
Marker( 0 ),
Marker Theme( "" ),
Continuous Scale( 0 ),
Reverse Scale( 0 ),
Excluded Rows( 0 )
)}
)
)
)
Why is this idea important? - Sometime, we use color to match county, customer company to make story more appealing.