cancel
Showing results for 
Show  only  | Search instead for 
Did you mean: 
  • JMP Security Notice: CVE-2026-109618 and CVE-2026-109619

    JMP promptly initiated a review of its products, services, and relevant infrastructure for exposure to CVE-2026-109618 and CVE-2026-109619.

    Our assessment of JMP products has not identified exposure to these vulnerabilities. Where remediation was required within supporting environments, appropriate security updates and controls have been applied and validated.

    We have identified no evidence of successful exploitation or unauthorized access to JMP systems or customer information associated with these vulnerabilities.

    JMP continues to monitor the issue and relevant vendor guidance. No action is required by JMP customers at this time.

  • Don’t miss your chance to experience Discovery Summit Europe at our best available rate! Early bird registration through 31 Oct.
  • Graph Builder Toolbar streamlines interactive graphing. Creates shortcuts on Report and GraphBuilder Helpers toolbars. Download and install the extension.

JMP Wish List

We want to hear your ideas for improving JMP. Share them here.
Choose Language Hide Translation Bar

Allow Boxplot widths in Graph Builder to be proportional to group size

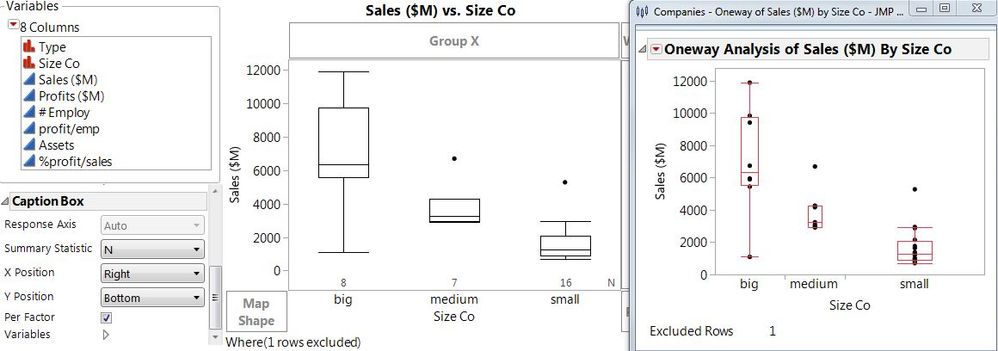
I'm often asked whether it's possible to make boxplot widths in Graph Builder proportional to group size, and I think this would be a very useful option.


In Fit Y by X this works by using a proportional X axis. Since JMP 14 it's also possible to indicate group sizes by using Caption Box with Per Factor, which is great, but proportional widths would make differences more obvious.
 

BoxPlot_Proportional_N.JPG

3 Comments
Jeff_Perkinson
Community Manager
Status changed to: Yes, Stay Tuned!

JMP 16 will support proportional axes for box plots.

Jeff_Perkinson
Community Manager
Status changed to: Delivered

In JMP 16 the Size role in Graph Builder will control the width of box plots.


2021-03-30_11-06-42.217.png


hogi
Level XIII

Thanks, quite useful.

I think for bar graphs , this feature will be extremely useful!
Similar to mosaic plot, but with the additional possibilities of bar graph.