cancel
Showing results for 
Show  only  | Search instead for 
Did you mean: 
  • Don’t miss your chance to experience Discovery Summit Europe at our best available rate! Early bird registration through 31 Oct.
  • Graph Builder Toolbar streamlines interactive graphing. Creates shortcuts on Report and GraphBuilder Helpers toolbars. Download and install the extension.
  • JMP will suspend normal business operations for our Rest and Recharge Day on Friday, October 2, 2026.
    Regular business hours will resume on Monday, October 5, 2026.

JMP Library

Choose Language Hide Translation Bar
Format Values in Prediction Profilers

To change the format of values and their confidence intervals in Prediction Profilers, change the format of the response column in the associated data table.

  1. In a data table, right-click the response column and select Column Info.
  2. Change the format and click OK.
  3. Run the Prediction Profiler report.

In the examples below, the initial format is updated from Best, Width 10 to Fixed Dec, Width 10 Dec 2 (which shows only two places after the decimal point).
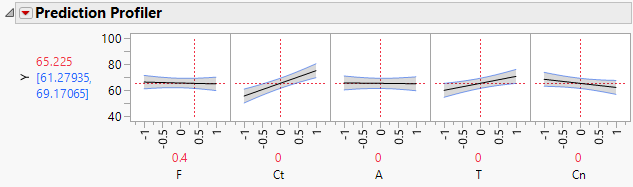
Initial Format of Values in ProfilerInitial Format of Values in Profiler

Initial Format: Best, Width 10

Updated Format of Values in Profiler

Updated Format: Fixed Dec, Width 10 Dec 2

Recommended Articles