This guide provides instructions on creating P and NP attribute control charts. P charts are often used to plot the proportion of nonconforming (defective) items per subgroup, while NP charts are often used to plot the number of nonconforming items p er subgroup.
P Charts
- From an open JMP® data table, select Analyze > Quality and Process > Control Chart > P Control Chart
- Select one or more continuous variables from Select Columns, and click Process.
- Select the column defining the number of trials (i.e, sample size) for the n Trials role. Click OK. Note: If sample sizes are not constant, the control limits will vary.
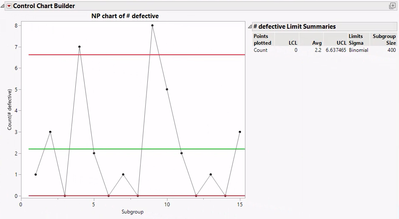
NP Charts
- From an open JMP data table, select Analyze > Quality and Process > Control Chart > NP Control Chart
- Select one or more continuous variables from Select Columns, and click Process.
- Select the column defining the number of trials (i.e, sample size) for the n Trials role. Click OK.
Tips:
- The process variable must be sorted in time order.
- Many options, such as tests for special causes and capability analysis, are available from the red triangles.
 Washers.jmp (Help > Sample Data Folder > Quality Control)


Visit Quality and Process Methods > Legacy Control Charts in JMP Help to learn more.